I believe I spoke
too soon, and too inconclusively, in stating
that this Southeast TX event was a clear indication that the FV3 was
wetter in its lead-up forecasts than the GFS. There is obviously A
LOT of data to visualize and sift through to make such a comment, and
I should be more careful and thorough. However, I'm also trying to
find the right balance in creating content for these model evaluation
forums, versus the amount of available time.
Granted the prior (original) post was showing Total Precip (Rainfall)
forecasts through
12Z, Sun Jul 8th, around the
Houston area, but we've
already had an impacting amount of rainfall,
as can be seen in the below two graphics.
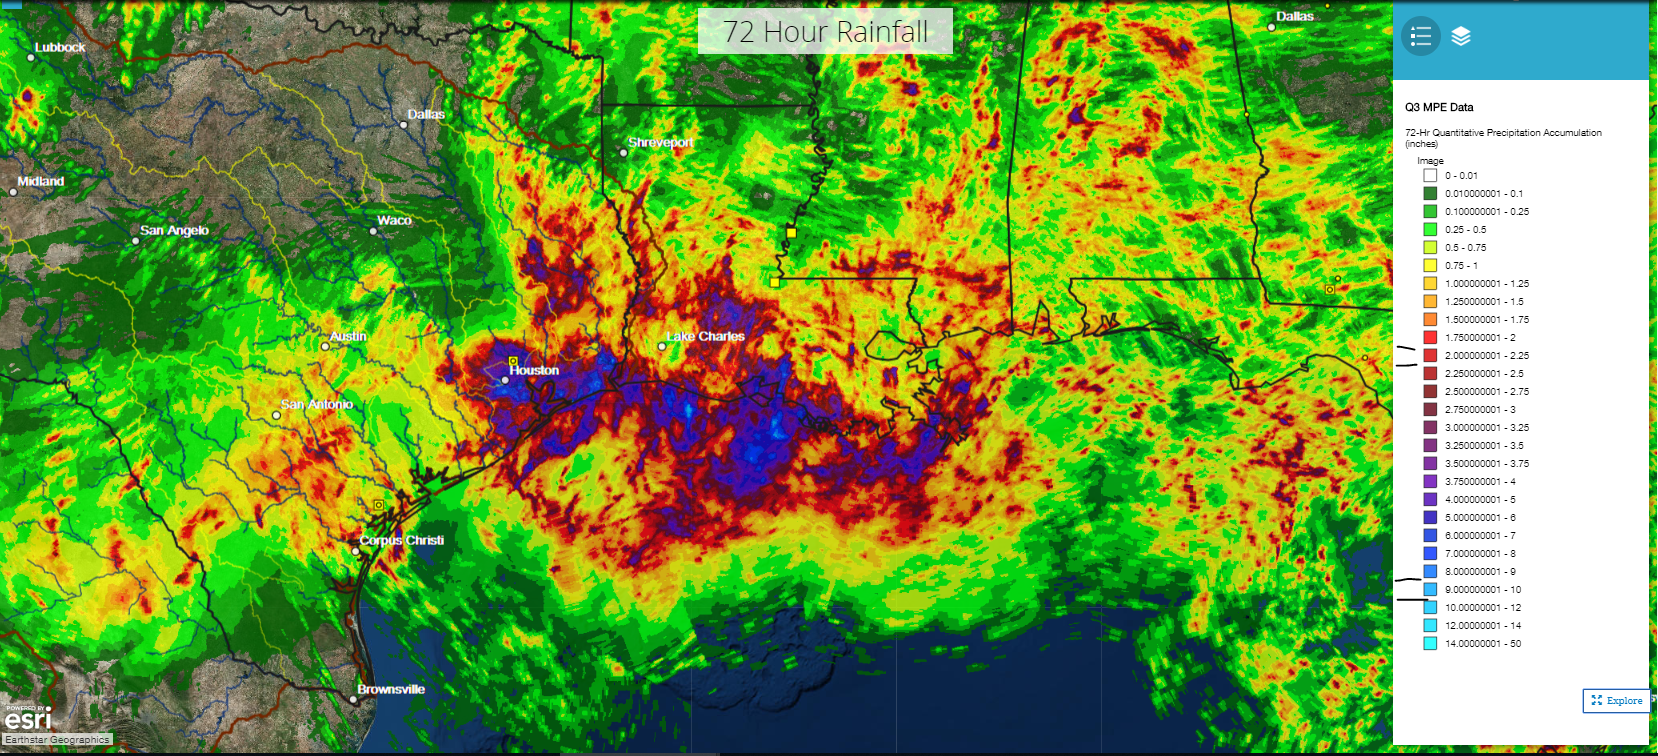
This first image is showing 72-hr MRMS Q3 rainfall totals (not QCed)
with a valid ending time
~17Z, Thu Jul 5th. On the color scale of this
image, the reds begin the amounts equal or greater than 2
inches. The deeper blues and cyan are showing amounts in
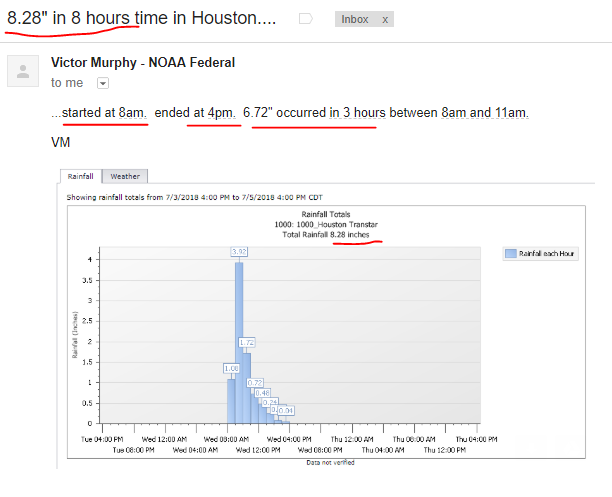
excess of 6 inches. , A Harris County Flood Control
District gauge located at I-10 West and West Loop 610 in
Houston reported in
excess of 8 inches, all which fell
within a mere ~8 hours the morning of the July 4th
holiday!! [Data
link and image provided by Victor Murphy.]
So, suffice it to say, this already has been a significant event, but
hopefully one that is mostly over.
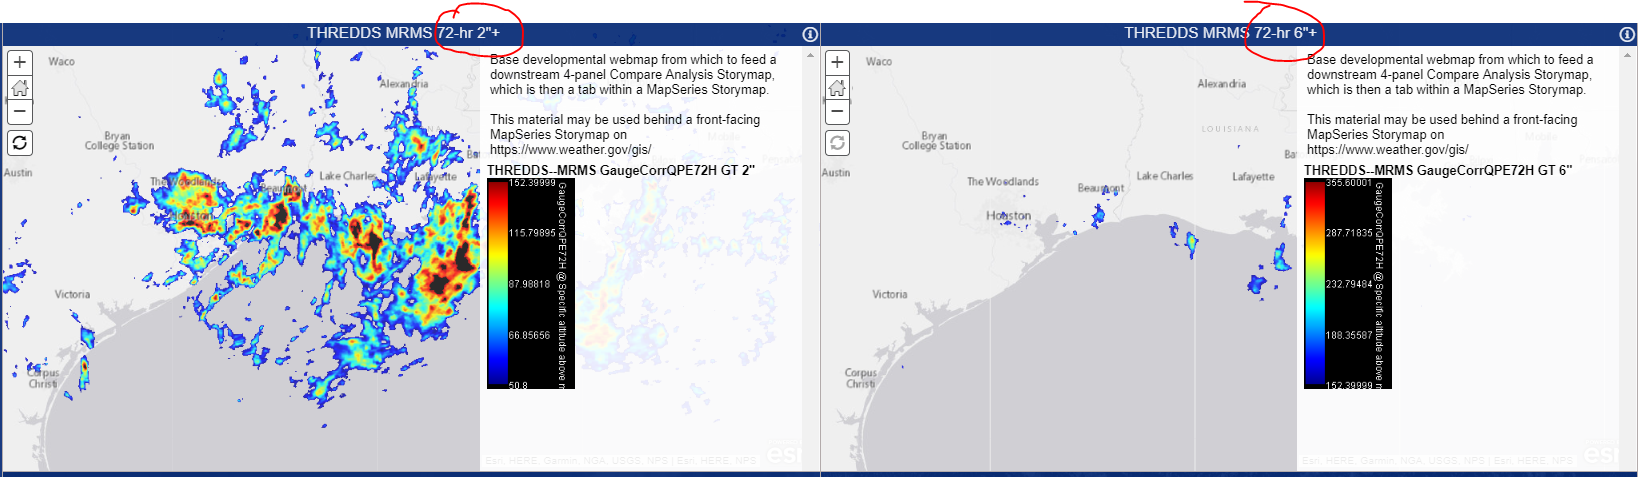
In this below 2-panel image, is the same 72-hr MRMS data, as pulled
from a UCAR THREDDS data server, and near the same ending time,
~20Z, Thu Jul 6. These images are designed to
only BEGIN their color curves at user-selected 72-hr rainfall amount
totals. On the left, the colored areas show where
at least 2 inches (50.8mm) of rainfall fell.
So, the areas should roughly match the reds and amounts above from the
image above. Areas in black on the left, are off the high end of the
left image's color scale, and are in excess of 6 inches, which is the
same amount (6") where the image on the right BEGINS its
coloration. This may seem confusing, but displaying it in this way,
using filtered WMS pulls from a THREDDS server allows a user to convey
more precisely details about an event (future, present, or past).
So, suffice it to say, some rather HEAVY amounts (amounts exceeding
monthly average totals) fell, though these amounts should not have
been TOO surprising, given the tropical underpinnings of the low
pressure system that produced the rainfall.
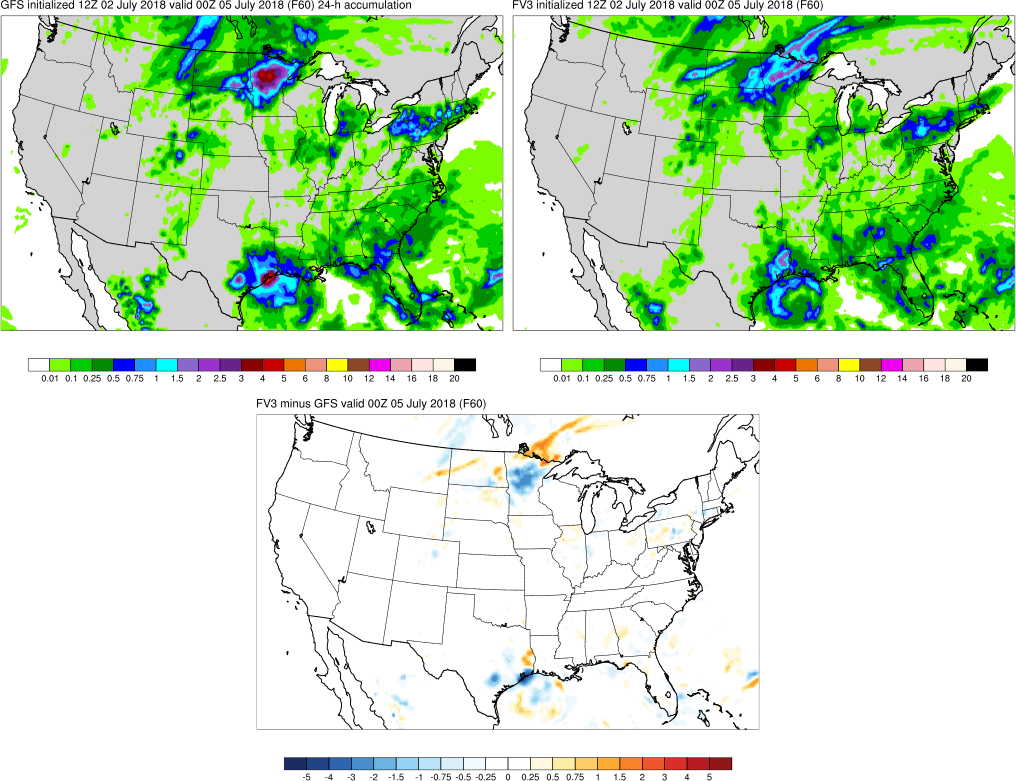
Below, is a cherry-picked image (in contrast to the trend loops
posted earlier) from EMC's
Geoff Manikin's FV3/GFS compare site that shows the 60-hr
forecasts of the 24-hour forecast rainfall amounts from the GFS on the
left, and FV3 on the right, ending at 00Z, Jul 5. This image not only
shows this particular GFS forecast indicating
higher 24-hr rainfall totals (5-6 inches if I'm seeing the
colors right)
right over Houston, but also
amounts, for this one snapshot, that are in excess of the FV3. A
pretty good forecast.
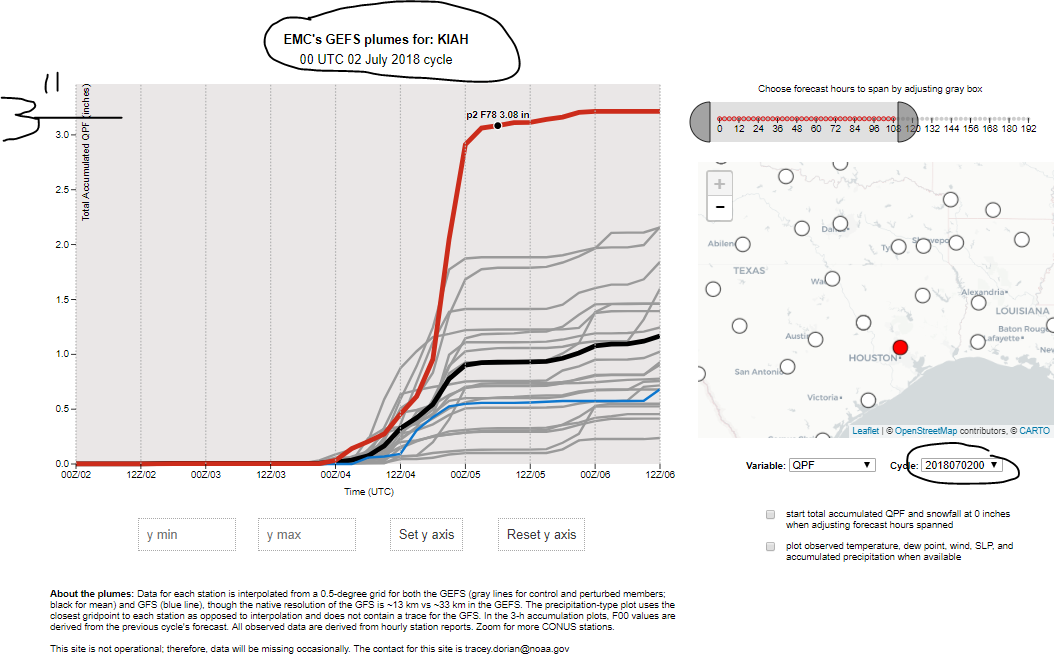
I will close this updated post out with sharing a
GEFS QPF plume for KIAH (available from Tracy's
site here) from the
00Z, Jul 2nd run, which shows a
>3 inch forecast to fall on July 4th.