This past week, areas along the Texas Gulf Coast received up to
20" of rainfall.
Throughout the week, I've been gathering images from MDL's NBM Viewer
to review performance of that forecast guidance, on shorter time
scales, but to close out the week, I wanted to a) refer to those NBM
VLab Forum posts, but b) also show some FV3 forecasts prior to the event.
Here are the 3 (feel free to rate them! :)) posts I made there (you
may have to Join that community to review).
1) https://vlab.noaa.gov/group/national-blend-of-models/discussions-forums-/-/message_boards/message/4278068
2) https://vlab.noaa.gov/group/national-blend-of-models/discussions-forums-/-/message_boards/message/4298448
3) https://vlab.noaa.gov/group/national-blend-of-models/discussions-forums-/-/message_boards/message/4306587
So, in the above posts, I was looking at 72-hr QPF forecasts from
various forecast systems (NDFD, NBM v3.0 and 3.1, WPC, and GMOS) with
end times at 00Z and 12Z Wed Jun 20th. So, forecasts ~72 hours in advance.
Below, I'm going to show images comparing the GFS and FV3, from
select forecast hours (yes, I'm cherry-picking; but feel free to
review the forecast hours of your choice using
this
link), BUT in these FV3 images, we can only look
at
24-hr rainfall accumulations, despite the
interface labeling them as Total Precipitation, which had me thinking
they were Run Accumulation images. But at least they are the same
end time of 00Z, Wed Jun 20.
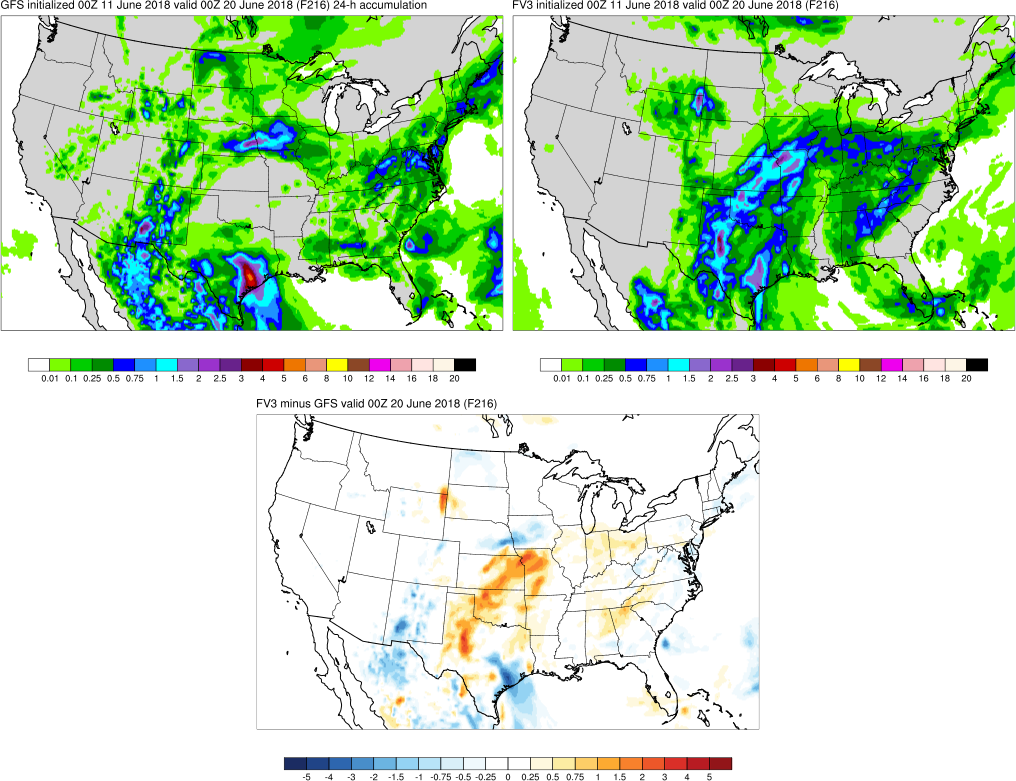
First, I thought I'd show the first
forecast hour (=216)
to show that there would be heavy
rainfall totals along the TX coast. The GFS, here, outperformed the
FV3, by showing a >5" area right about over Shiner, TX.
Granted, the peak rainfall areas in Texas with this event, ending at
this forecast time were not in that location, the models were
suggesting a heavy rain event.
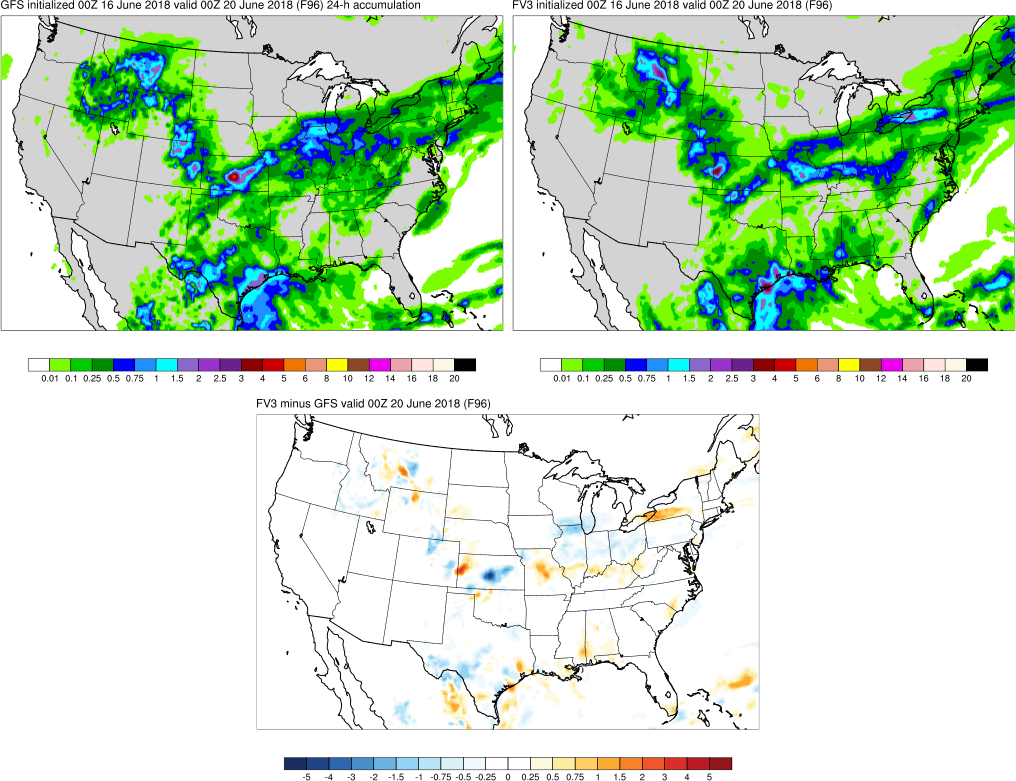
Next, let's jump to
forecast hour=096
, at which time the FV3 showed two distinct fingers of greater
than 2" rainfall, whereas the GFS showed >1.5" area
along a broad swath of coast. It's arguable which is better here.
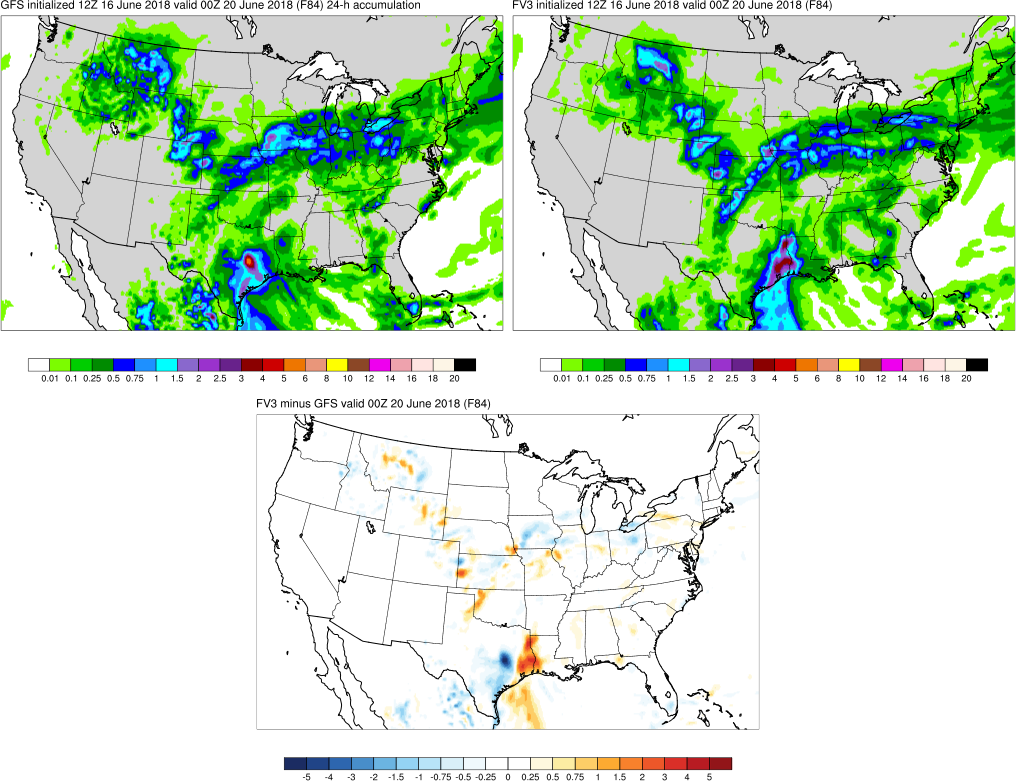
Next,
forecast hour=084,
at which time the GFS again showed a >5" area (these are
24-hr rainfall forecasts) around Shiner, TX, whereas the FV3
correctly showed the heaviest swath of rain would be in a band that
stretch north/south across Beaumont, TX where some of the highest
rainfall totals were observed (along with amounts around WFOs CRP
and BRO). Both good forecast guidance 84hours in advance of the event.
Lastly,
at forecast hour=060,
the superiority of the FV3 (for this cherry-picked snapshot in
time) is evident as it nailed the swath of heavy rain that occurred
near Beaumont, TX near the LA border. The FV3 was capable of
showing an area of 8-10" of rainfall right near where amounts
near that amount fell, with even more than 10" observed if one
adds in adjacent time periods.

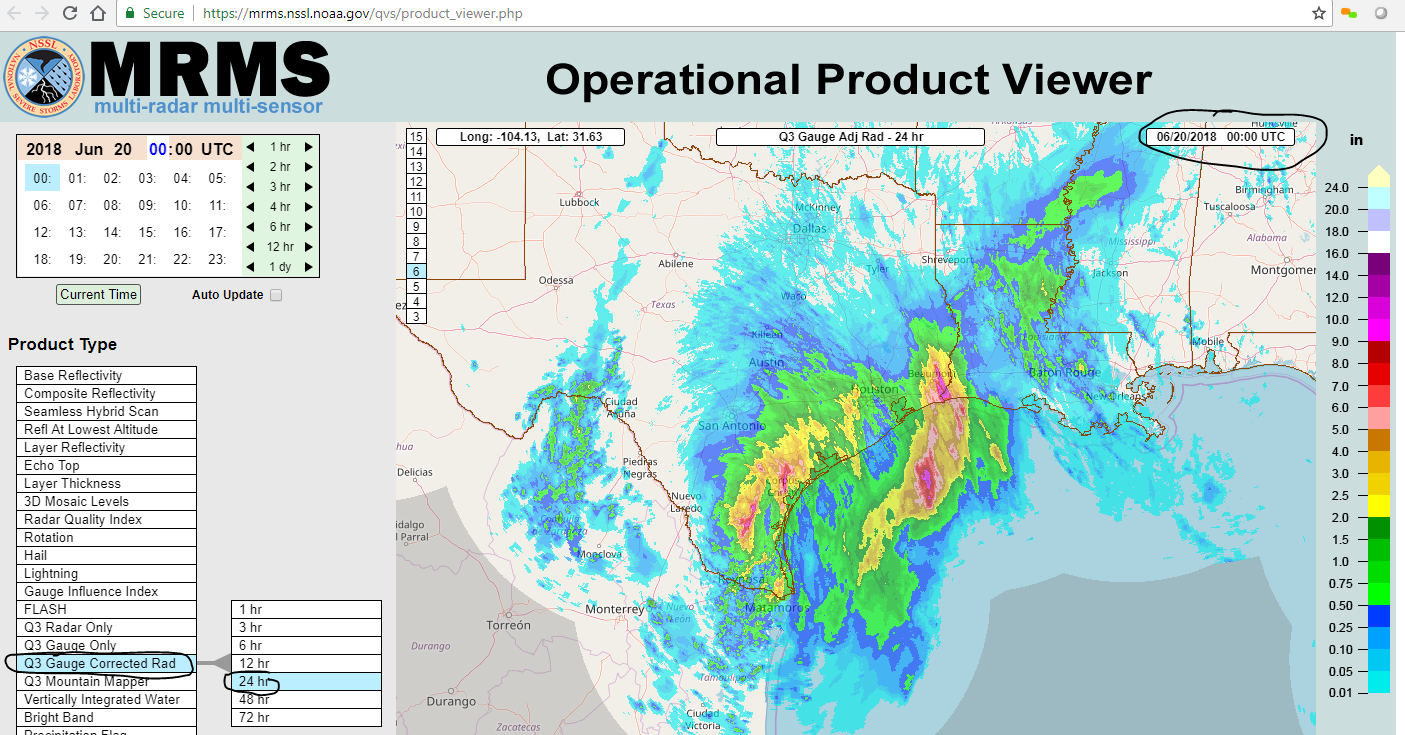
And, just to show the observed amounts, here is a view of the 24-hr
totals ending at 00Z, Wed Jun 20th, as pulled from the
MRMS viewer: