Much of the following material is internal and in development, but I wanted to share what can be, for the greater scientific good.
Jon Zeitler, our Austin/San Antonio, TX Science and Operations Officer (SOO) has been involved in the development of these data and tools, and shared this material in an email to the NWS SR SOOs and Development and Operational Hydrologists (DOHs) community. I'm simply reposting here without permission, though I'm sure Jon doesn't mind, as a test of how simply the material could have been shared here just the same, and been shared with an even larger collaborative community.
With the fast approach of the "early fall stalled fronts and remnant tropical moisture season," and coinciding with training planning for a new FY, here is a reminder for the Extreme Precipitation Frequency Table.
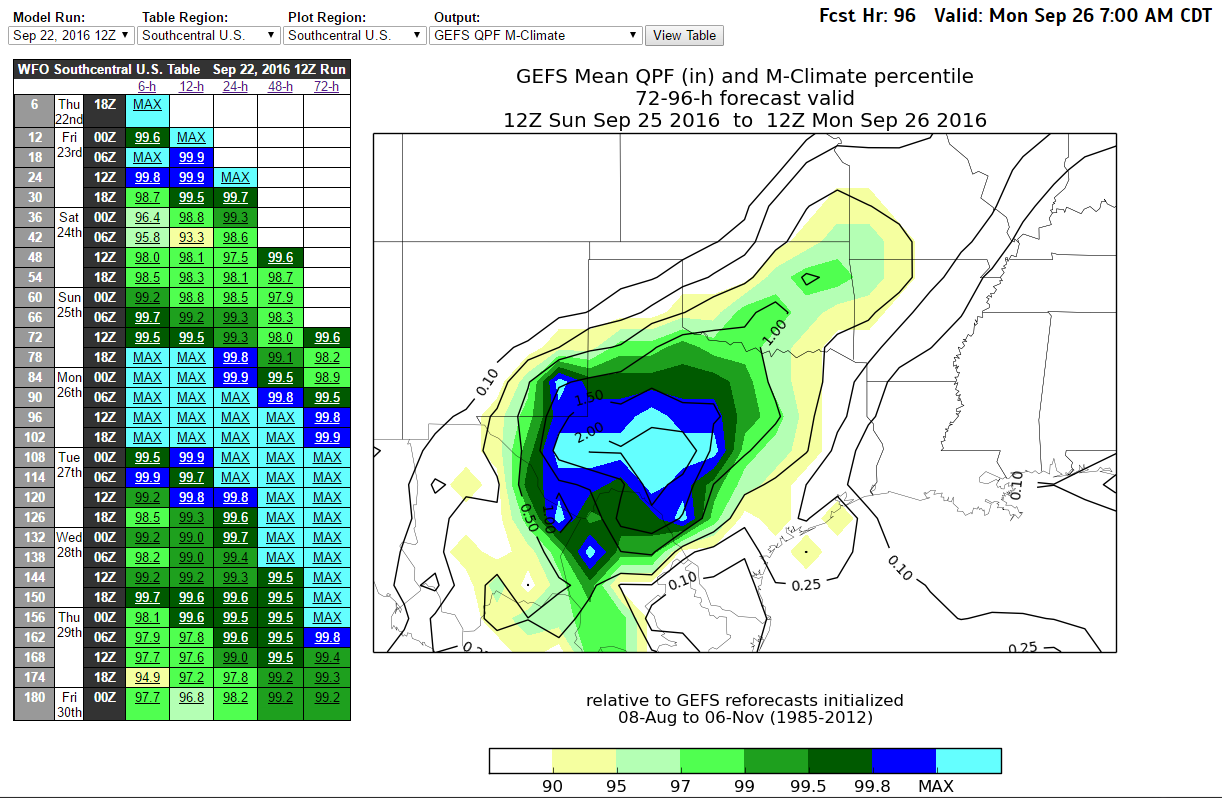
1) Especially for Texas/NM/OK WFOs, the event late this weekend/early next week offers an opportunity to get a look at the tool for an extreme event (at least if reality approaches the GFS). A companion tool is the WR Ensemble Situational Awareness Table. Here's what the GEFS M-Climate is showing for the 24-hour period Sunday morning-Monday morning:

2) Here is what the EPFT looked like in GFE for the EWX domain Thursday afternoon, based on the 12Z model runs. Note the color coding. This table is telling us the GFS is on it's own in projecting an extreme QPF event (the ECMWF/GEM are in the table, but trimmed out of this view), and WPC seems to be accounting for the possibility the GFS may be right by forecasting QPF higher than consensus methods such as CONSAll, SuperBlend, etc. The corresponding grid map is for the 06-12Z Monday period (more on that in following images).

3. Here is the corresponding deterministic GFS QPF for 06-12Z Monday in the EWX GFE domain:

4. Here is the deterministic GFS EPFT again for 06-12Z Monday in the EWX GFE domain. The peak value of 83.36% indicates one grid point will have 83.36% of the 100-year, 6-hour rainfall for that period. The grids shaded in orange would all receive 75% or greater of the 100-year, 6-hour rainfall for that period. So while the straight QPF in the previous image may also lead a forecaster to the primary area of threat, that is dependent on color curve applied and their knowledge of how QPF relates to historical/climatological rainfall The EPFT is standardized to the statistical 100-year event, and is color-coded based on observations of major flood events, with the 75% percentile generally well-correlated with significant flooding.

Caveats with this tool:
1. IT IS DEPENDENT ON MODEL QPF! If the model QPF is wrong (location, timing, amount), the tool will be wrong.
2. It has no information on antecedent soil moisture, flow state of rivers, etc.. This tool only identifies the percentage that model QPF is of the 100-year, 6-hour (also 24-hour in Texas, and other intervals outside of Texas) rainfall amounts derived from historical precipitation analyses. While high values ( >75%) will generally lead to significant flooding, there is no direct relationship that X% will lead to Y flooding.
3. The best use of the tool is to compare among models in the table, look for trends and consistency in location, timing, and percentage (amount), then apply that to collaboration with neighbor WFOs, WPC, and your RFC, messaging to partners, and consideration of potential flood scenarios given antecedent soil moisture, current river state, etc.
I plan to write up a more thorough case study when the event is over.
Thanks,
-Jon
Adding in some "verification" images.
24-hr Observed Rainfall ending 12Z Sep 26:
12-hr Observed Rainfall from 03-15Z Sep 26.


