One of our closest core partners is the wildland fire community, and
of critical importance to them is wind and humidity. I know there have
been other discussions about wind, so I'll just focus on humidity here.
We would like to use the NBM as our default guidance for everything,
but we've found this prescribed fire season that it falls far short of
the SuperBlend when it comes to humidity forecasting. I think the root
cause of that is the URMA which the NBM uses for bias correction. I
compared the Obs grid to the URMA analysis at several stations in our
area and found pretty big differences between the two analyses.
The first example is KBTM, one of our ASOS sites:
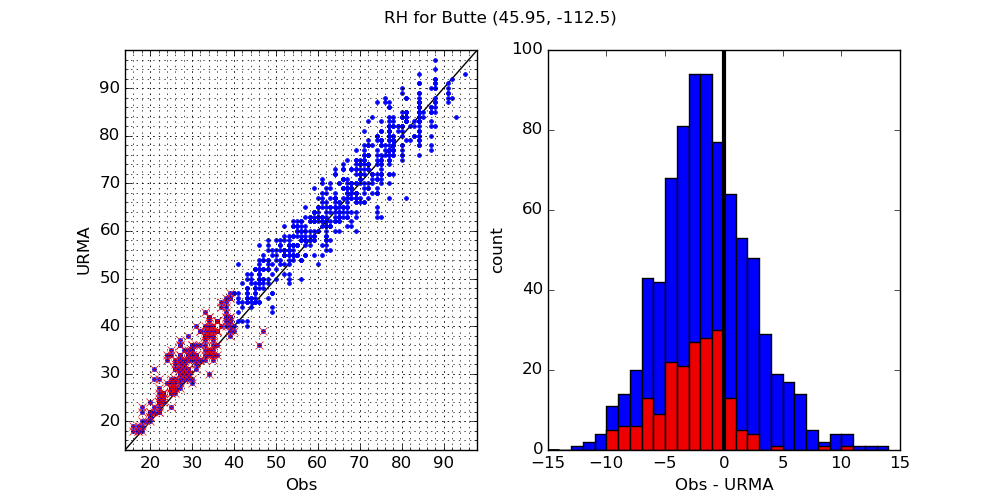
There's a couple of things here I'd like to point out. First, the
error histogram (right) is wide, stretching out to ±10%. Second, I
highlighted all the cases where either the Obs or URMA grids were
below 40% humidity. This is the dry side where we could actually have
prescribed fire; this is the range our fire customers care about the
most. Notice in the lower RH area the URMA has a wet bias compared to
the Obs grid. This is also reflected on the MinRH plot below.
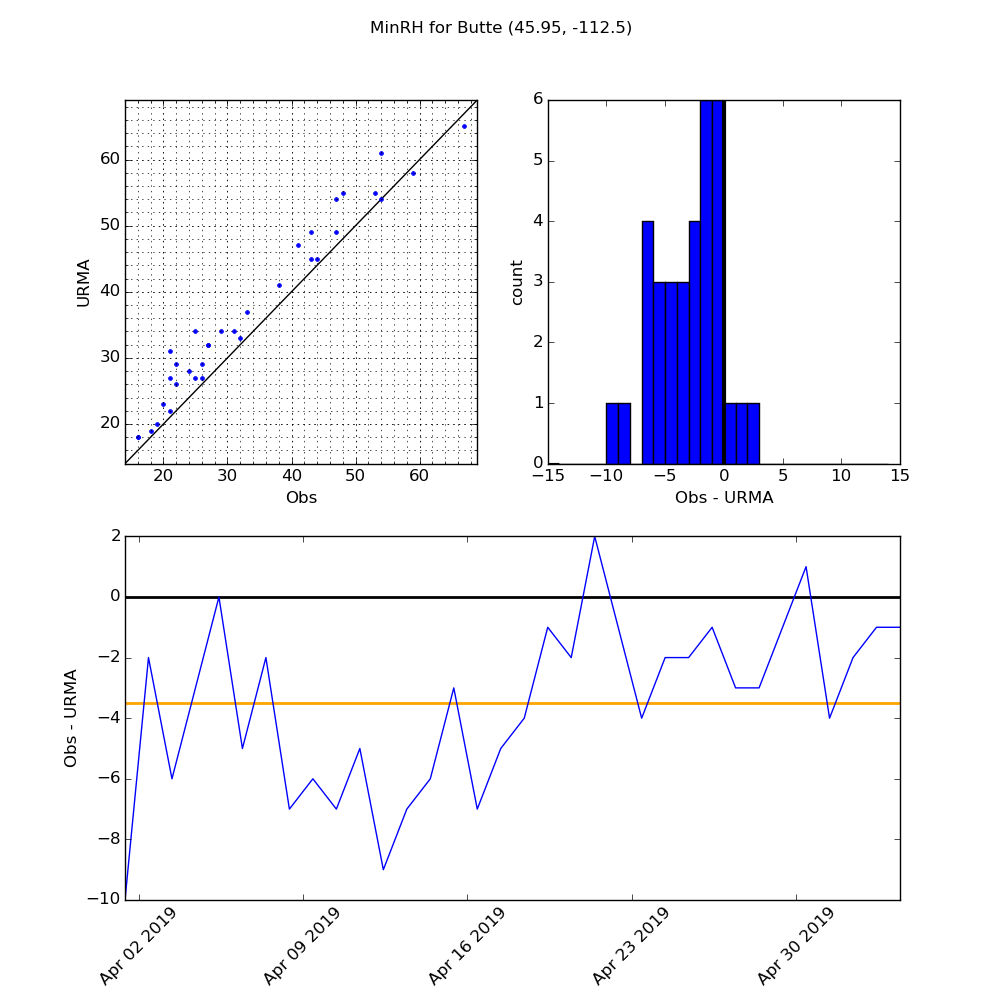
MinRH is a part of every Spot forecast we put out, but it is also
available through NDFD, so burners have access to it through other
means as well, so if we are constantly adjusting it down for the Spots
we are sending a mixed message. This is exactly what has been
happening this spring.
Another case is the Lodge Pole RAWS (5,814 ft elevation).
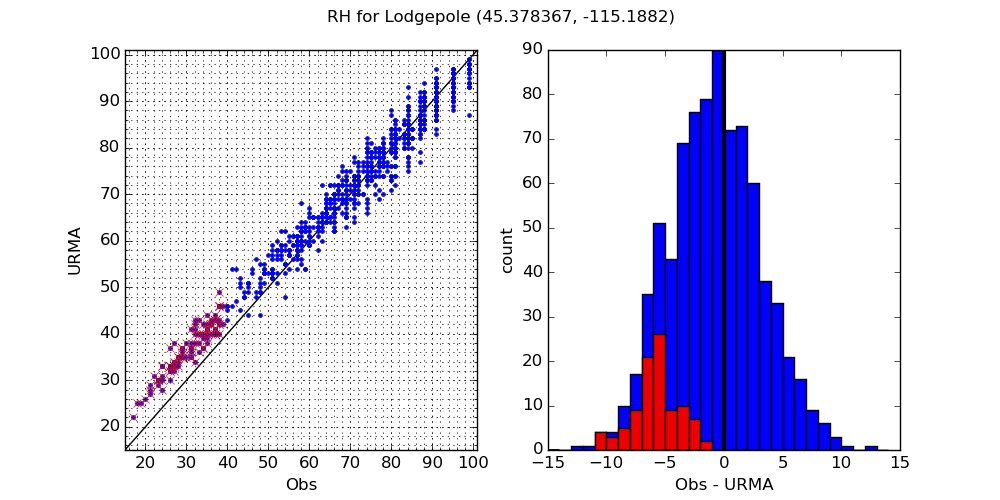
In this case the wet bias of the URMA in low humidity is even bigger.
This is generally the case for many RAWS stations in our area. I
assume the dew point/ RH from the ASOS's weighted heavier in the
analysis hence the better performance at Butte. There are some
locations in the low elevations of central Idaho where URMA actually
has a dry bias, but that hasn't been as much of an impact because most
of our fire weather customers have been in Montana so far this year,
but that could also be a problem.
I assume the URMA is analyzing dew points and then calculating the
humidity from that. I know that's how it is run in our SmartInits for
GFE. I know a lot of work has been done to improve the temperature
forecasting in the mountains, and I'm hoping some of those changes can
easily be translated to dew points so we could see an improvement in
the RH analysis/forecasts from URMA/NBM.
Our desire is to have a good humidity forecast because that is what
is important to our users, and it is what most sensors directly
measure (even if they report a dew point like ASOS). So if improved
dew points are the way to get there I'm all for it, but if there is
another way to get a good humidity analysis and forecast that works
just as well for us too.
For now, I'm going to recommend that the office go back to using
SuperBlend as the starting for our humidity grids.
Thanks,
Ryan Leach,
Senior Meteorologist, IMET, and GFE focal point
WFO Missoula


