Forums

Back

Re: [aor-rtma] RFCQPE & Stage IV Precip

YL
Ying Lin, modified 7 Years ago.

Re: [aor-rtma] RFCQPE & Stage IV Precip

Youngling Posts: 48 Join Date: 3/27/17 Recent Posts
Dave,

    What's the valid time/accumulation length of your two plots?  I see "Sun 02Z -7-Jan-18" in your first plot and maybe "Sun 06Z-7-Jan-18" in the second.  So was that 1h accumulation ending at 02Z 7th in the first, and 01h (or 06h) accumulation in the second?  Here's Stage IV/URMA:

http://nomads.ncep.noaa.gov/pub/data/nccf/com/pcpanl/prod/pcpanl.20180107/st4.2018010702.01h.gif, last updated at 02:35Z today (8th) 
http://nomads.ncep.noaa.gov/pub/data/nccf/com/pcpanl/prod/pcpanl.20180107/st4.2018010706.01h.gif, last updated at 06:37Z today
http://nomads.ncep.noaa.gov/pub/data/nccf/com/pcpanl/prod/pcpanl.20180107/st4.2018010706.06h.gif, last updated at 15:34Z today
http://nomads.ncep.noaa.gov/pub/data/nccf/com/pcpanl/prod/pcpanl.20180107/st4.2018010712.24h.gif, last updated at 12:38Z today

The ConUS mosaic changes a lot in the immediate hours after validation time as initial QPEs/updates are coming in.  Do your images look different now?  Please let me know of the validation times of your photo captures and the times you viewed them, and we'll go from there. 

Ying

On 01/08/2018 08:57 AM, John Lague - NOAA Federal wrote:
Your data not updating?  Or perhaps you ran this too early?  The AHPS precip looks much better:

The only data for mountainous areas comes from SNOTEL sites, which arrive later in the day and are difficult and time consuming to QC.  Also, there are very good reasons there may be discontinuities across a continental divide.

Also, I will probably so a further analysis of the data today.  This is not a real-time data source for verification, as discussed before.

See attached AHPS precip. image from this morning. 
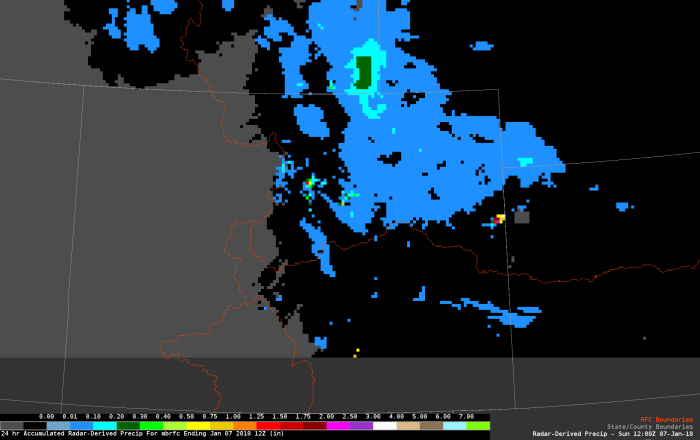
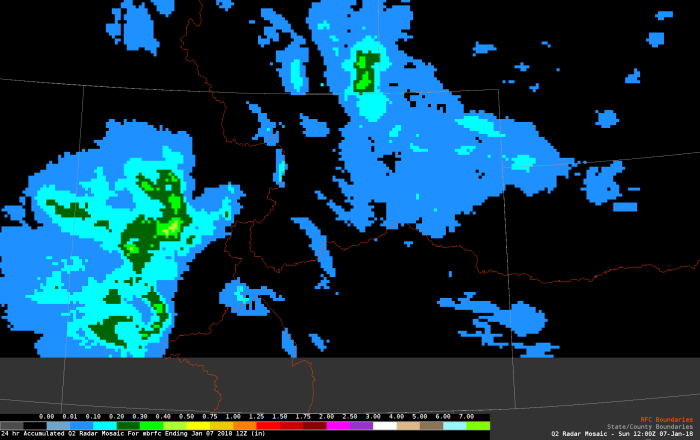
Also, attached RADAR summary for that day, and attached MRMS summary.

John

AHPS
RADAR

MRMS


On Mon, Jan 8, 2018 at 4:17 AM, David Barjenbruch - NOAA Federal <david.barjenbruch@noaa.gov> wrote:
Hi,

I was curious if I could get a status update on the discontinuities of the RFCQPE in this thread?  It's still showing up and here's another example from January 7 in the Colorado mountains.  Sorry for the waviness (had to take pictures on phone versus a true screen capture). Interest here surrounds the sharp discontinuities along the RFC boundaries (black lines).

Thanks!
Dave

​​​​Inline image 1

Inline image 2
 

On Thu, Apr 28, 2016 at 7:16 PM, Ying Lin <ying.lin@noaa.gov> wrote:
Dave (and John),

    Thank you very much for bringing this up - I see what you're saying, the precip URMA does indeed have discontinuities at the RFC boundaries.  Attached is a 3-pager with 1) 6-hourly URMA ending at 00/06/12/18Z 16 Apr (same as P1 in your pptx), 2) 6h URMA ending at 06Z 16th, and the contributing QPEs from ABRFC/CBRFC/MBRFC (WGRFC is outside of the plot domain), and 3) 24h totals of URMA ending at 12Z 16th, compared to the one from water.weather.gov.  The discontinuity in the 24h total of URMA does indeed jump on this scale.  I spent an inordinate amount of time trying to plot the water.weather.gov 24h Shapefile, but succeeded only in plotting them in monochrome dots.  Anyone knows how to plot a field array Shapefile [not boundary Shapefiles] or NetCDF using GrADS or Python?  Or the RGB color scheme used on the Water site?

    Attached are two files, the OpenOffice 'presentation' (*.odp, created on Linux but should be viewable on Windows with PowerPoint), and the same document exported to PDF. 

    I'll ask Water/AHPS people about how they deal with discontinuities at the RFC boundaries.

Ying


On 04/25/2016 03:32 PM, John Lague - NOAA Federal wrote:
David,
All I can say about the "RFC QPE06" pictured is that it looks different than the QPE we have locally.  I don't know how the data get to you, nor exactly what data it is...so I cannot verify what you are seeing is correct.  The RFC's have been excluded from this process, so it is not really possible for us to answer many detailed questions about it.

You can see from the daily images from water.weather.gov that the 24 hour amounts look fairly good considering we are going over a continental divide.   This web site, and the SRH hourly QPE site are all we really have to go buy.  We don't have any other way to see the neighboring RFC estimates. And there is a good deal of delay before any updates we make get posted.

Much of the issues appear to be differences in the way 24 hour data is time distributed into 6 hour amounts.  This is often problematic, as different gauge networks will be used to provide ratios for time distribution.  In addition, much of the mountain data will be from SNOTEL sites.  SNOTEL data has a great deal of noise is difficult to use even on a six hour basis.

John


On Sun, Apr 24, 2016 at 12:09 PM, David Barjenbruch - NOAA Federal <david.barjenbruch@noaa.gov> wrote:
In an attempt to provide more feedback and improvement in the QPE and verification process, here's another PowerPoint showing the discrepancies in the RFC QPE's for our last significant precipitation event here in Colorado.

Summary of the QPE and where it stands - please let me know if I'm mistaken:

  • URMA is stage IV precip remapped to a 2.5 km grid. This is a mosaic from RFC QPE06.
  • The attached RFC QPE06 graphics in the Powerpoint are those stored at NWS Boulder and available in GFE.  These grids were captured on 04/24/16 for a precipitation event that occurred on 04/16-17/16.
  • The attached URMA analyses in the Powerpoint were captured from the mdl.nws.noaa.gov National Blend of models site on 04/24/16 for the same precipitation event.
  • We realize the URMA analyses are zero for at least the MBRFC here in NWS Boulder, but appears ABRFC is arriving more consistently. CBRFC URMA grids are sporadic.  The new NWSInitsConfig install should ensure the URMA grids are reprocessed. Will this bring in the surrounding grids more reliably, and approximately when can this fix be anticipated?
  • There is considerable discrepancies with regard to QPE from the various RFC's, sometimes completely reversing for periods of time (e.g. difference between MBRFC and CBRFC for the 00Z-12Z 17 April time frame, despite a similar flow regime). Are different methods being used at different times within the RFC's?
  • The water.weather.gov site does not show these variations through time.  From Ying's email the differences should only be slight, but considerable differences are still noted. Those images are attached to the Powerpoint as well.

For your reference, there are short descriptions of the Powerpoint in the notes section at the bottom of each slide.  

Thanks again for all your help on this!
Dave


On Wed, Mar 30, 2016 at 5:26 PM, Ying Lin <ying.lin@noaa.gov> wrote:
Hello! I've been away and catching up right now.  Info in Brian's 23 Mar email is correct. Precip URMA is simply the Stage IV 6-hourly mapped to the 2.5km NDFD grid.  To capture as much of the early input and late updates from the RFCs as possible, mosaicking for the 6-hourly fields is remade hourly (if there is input) for the first 24 hours after valid time, then the four 6-hourlies covering a 12Z-12Z 24h period are re-made at 1/3/5/7 days after the ending 12Z  (i.e. at the 12:33Z run).  water.weather.gov doesn't use Stage IV, but there differences should be slight (e.g. they don't include Great Lakes coverage yet).  I understand only from reading this thread that RFCQPE is a Central Region-wide mosaic.

Please let me know if you have other questions. 

Ying


On 03/23/2016 09:21 AM, Brian Miretzky - NOAA Federal wrote:
Jeff and all,

To clarify,
URMA/Stage 4 are essentially the same. Stage 4 is simply remapped to the URMA 2.5 km grid, which could introduce some slight differences. Additional slight differences are possible between water.weather.gov and the Stage 4 NCEP analysis because of slight processing differences between the two. What CR is doing to create the "RFCQPE" I am not sure, but if there are concerns Ying Lin (http://www.emc.ncep.noaa.gov/mmb/ylin/pcpanl/) is your contact for addressing these issues further.

Thanks,

Brian

On Mon, Mar 21, 2016 at 9:52 AM, Jeffrey Craven - NOAA Federal <jeffrey.craven@noaa.gov> wrote:
My recollection from MKX was that the RFCQPE had a latency of about 36 hours.  

JPC

Jeff Craven
Chief, CR Scientific Services (STI)
NWS CRH Kansas City, MO
(816) 506-9783 cell/text
**NWS Impact Based Decision Support Services:
 The Blend is our friend - our expertise is what matters**

On Mon, Mar 21, 2016 at 8:44 AM, Mike DeWeese - NOAA Federal <mike.deweese@noaa.gov> wrote:
What time is the RFCQPE downloaded?  At NCRFC, we sometimes reprocess the hourly QPE back as far as 72 hours following an event or following a weekend event.  So the most reliable QC'd  data set is not necessarily available on a 24 hour cycle.

Mike

On Sat, Mar 19, 2016 at 8:01 PM, Jerry Wiedenfeld - NOAA Federal <jerry.wiedenfeld@noaa.gov> wrote:
Matt grabs all of the RFC QPE data and mosaics it at region and sends that data via LDM to all WFOs in CR as RFCQPE.

QPF12 and PoP12 verification uses RFCQPE.  1 hour PoP verification is currently using MPE data.  This may change to RTMA but I have found the MPE data is better as long as it is qced at the office.

With the upcoming tech note the urma25 data will be used for verification for PoP12 and QPF12.

Jerry 
On Saturday, March 19, 2016, Jeffrey Craven - NOAA Federal <jeffrey.craven@noaa.gov> wrote:
Thanks Scott.  My understanding is that we grab a file called RFCQPE, which is supposed to be the same as what URMA is using.  

I have included Matt Foster and Jerry since they have set up the verification of our PoP and QPF grids based RFCQPE. 

JPC

Jeff Craven
Chief, CR Scientific Services (STI)
NWS CRH Kansas City, MO
(816) 506-9783 cell/text
**NWS Impact Based Decision Support Services:
 The Blend is our friend - our expertise is what matters**

On Sat, Mar 19, 2016 at 9:31 AM, Scott Dummer - NOAA Federal <scott.dummer@noaa.gov> wrote:
Paul,

The MBRFC uses DailyQC to help calculate its QPE in the mountainous western portion of it area.  It appears the water.weather.gov image is capturing the DailyQC analysis, while the grids in GFE are using our MPE only grids.  Daily QC relies on point precipitation amounts and extrapolates these into gridded amounts based on PRISM climatological precipitation data which varies based on elevation.

Since this seems like a CRH SSD 'Grids' item, I am redirecting it to John Eise of CRH SSD.  He, or one of his contacts can give a better answer.

John Lague our Senior HAS Forecast might also have something to offer on this as well.

Thanks,

Scott

On Wed, Mar 16, 2016 at 3:14 PM, Paul Wolyn - NOAA Federal <paul.wolyn@noaa.gov> wrote:
Please see this attached powerpoint from Dave Barjenbruch at WFO Boulder concerning RFC QPE discontinuities in GFE.  Is GFE using the same data source at water.weather.gov?

Thanks,
Paul

---------- Forwarded message ----------
From: David Barjenbruch - NOAA Federal <david.barjenbruch@noaa.gov>
Date: Fri, Mar 11, 2016 at 8:27 PM
Subject: RFCQPE & Stage IV Precip
To: Paul Wolyn - NOAA Federal <paul.wolyn@noaa.gov>
Cc: Nezette Rydell - NOAA Federal <nezette.rydell@noaa.gov>, Jennifer Stark - NOAA Federal <jennifer.stark@noaa.gov>, Benjamin Moyer - NOAA Federal <benjamin.moyer@noaa.gov>


Hi Paul,

Thanks for all your input into the RFCQPE, Stage IV precipitation analysis, and URMA.  It sounds like there is some strong movement in that area.  I had a couple more events to share with you about RFCQPE discontinuities.  They are in the attached PowerPoint with a short description in notes.

It appears the water.weather.gov site is using Stage IV Precip, is that correct?  The case examples in the PowerPoint show numerous and wide disparities in the RFCQPE (GFE grids - do you know what "Stage" that is?), but considerably less in the Stage IV Precip analysis.  CRH is using Stage IV precip for verification, correct?

Thanks, and feel free to pass on the PowerPoint if you feel it would be useful as a reference.
Dave B.

P.S. If you'd like me to look at anything in particular for URMA or CRGMAT let me know.  I can try and catch some examples or provide input.

-- 
David Barjenbruch
National Weather Service
Boulder, CO 80305


--
Jerry Wiedenfeld 
Information Technology Officer 
National Weather Service, Milwaukee/Sullivan, WI


--
Mike DeWeese
Development and Operations Hydrologist
North Central River Forecast Center


-- 
Ying Lin
NCEP/EMC/Mesoscale Modeling Branch
NCWCP Cubicle No. 2015
Ying.Lin@noaa.gov


--
David Barjenbruch
National Weather Service
Boulder, CO 80305


-- 
Ying Lin
NCEP/EMC/Mesoscale Modeling Branch
NCWCP Cubicle No. 2015
Ying.Lin@noaa.gov


--
David Barjenbruch
National Weather Service
Boulder, CO 80305
303-494-3210


-- 
Ying Lin
NCEP/EMC/Verification, Post-processing and Product Generation Branch
NCWCP Cubicle No. 2015
Ying.Lin@noaa.gov