Welcome

Welcome to the RTMA/URMA VLab community!

The purpose of this community is to facilitate feedback and discussion on the RTMA/URMA system. 

Meeting notes are available under the Google Drive Folder linked above.

To learn more about our next upgrade, see the asset publication below.

Use the System Overview to learn more about the system in general.

Use the forum to ask questions about the system and join the discussion with other users and the development team. 

Note that there are two forums: one for precipitation issues and one for all other variables.

You can post to the precip issues forum by sending an email to qpe.rtma.urma.feedback.vlab@noaa.gov.  For all other issues, you can post by sending an email to rtma.feedback.vlab@noaa.gov.  Please note that you must have a user account to post to the forum.  If you do not have an account, please contact matthew.t.morris@noaa.gov.

We recently added the ability for NWS Regional or WFO personnel to request that stations be removed from the analysis.  To access this, click on the "Station Reject Lists and Requests" tab.

There has been recent interest in knowing exact station locations, especially those of METAR sites.  Our METAR information table is under the "METAR Location Info" tab.

Users may also be interested in the National Blend of Models VLab community.

We appreciate any feedback on how this page or community could be improved.  You can submit such feedback via the above email handle or forum.


What's New

December 2017 Implementation Summary

Document

Overview of upgrade scheduled for December 2017. Note that this was originally scheduled for October 2017, but has been pushed back due to technical issues.

Forums

Back

More on Humidity Bias analysis

RL
Ryan Leach, modified 5 Years ago.

More on Humidity Bias analysis

Youngling Posts: 18 Join Date: 1/19/16 Recent Posts

All,


An update on the humidity bias in the URMA (which is impacting the NBM RH downstream). We'll look at two days in particular. The first is during prescribed fire season for us May 13th. I've attached the Obs grid analysis, URMA analysis, and a difference grid.


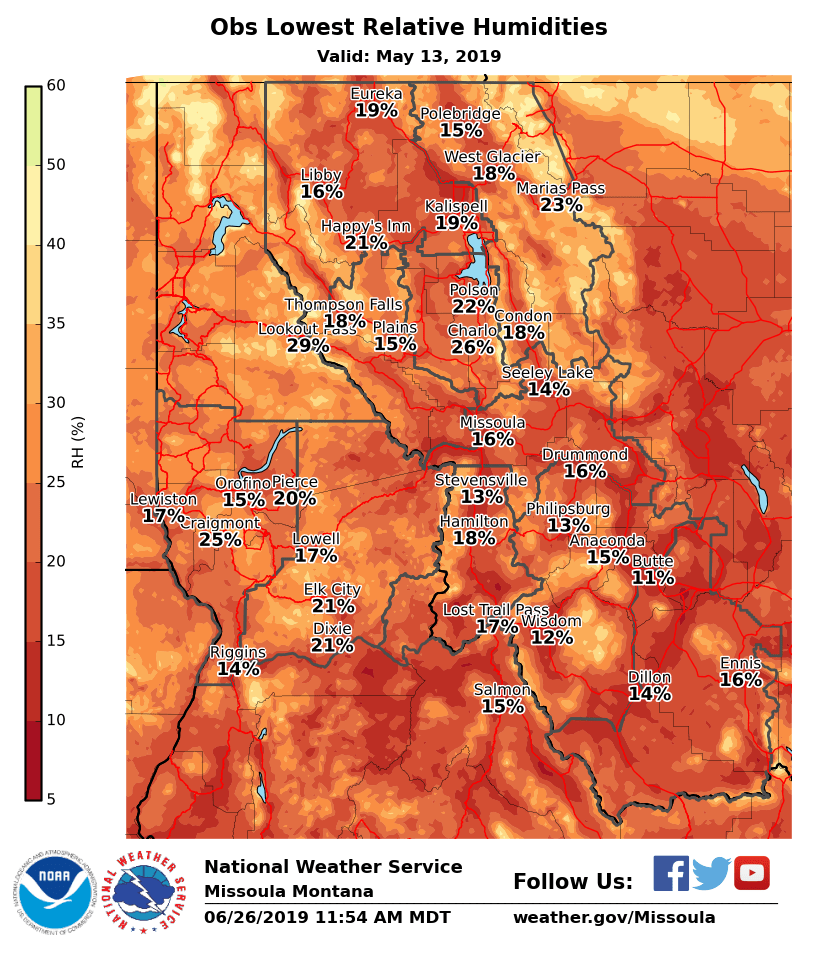
Generally speaking humidity ranged from 30% to the low teens at the higher elevations and were in the low teens at the lower elevations. This ranges from and area where prescribed fire burners can just start to burn to potentially being too dry in other areas. The URMA analysis is below for comparison.

And below is the difference between the two analysis. 

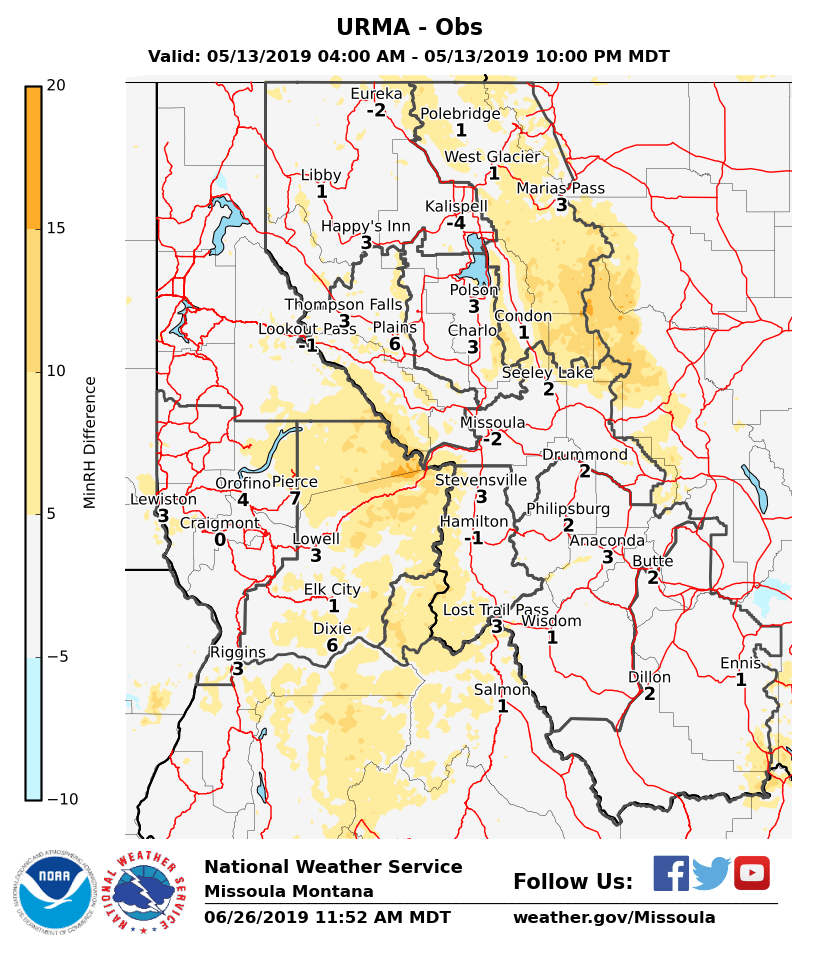
On this day the low elevation temperatures were in the upper 70s with high elevation temperatures near 60F.  The difference image gives a generous 5% between categories.  Doing a rough calculation using a temperature of 60F, and considering observed humidity in the range 15-25%, in order to get a 5% difference the dew points must have been different by around 5 degrees.  And looking at the shading there are some areas that have differences in the 15-20% range.


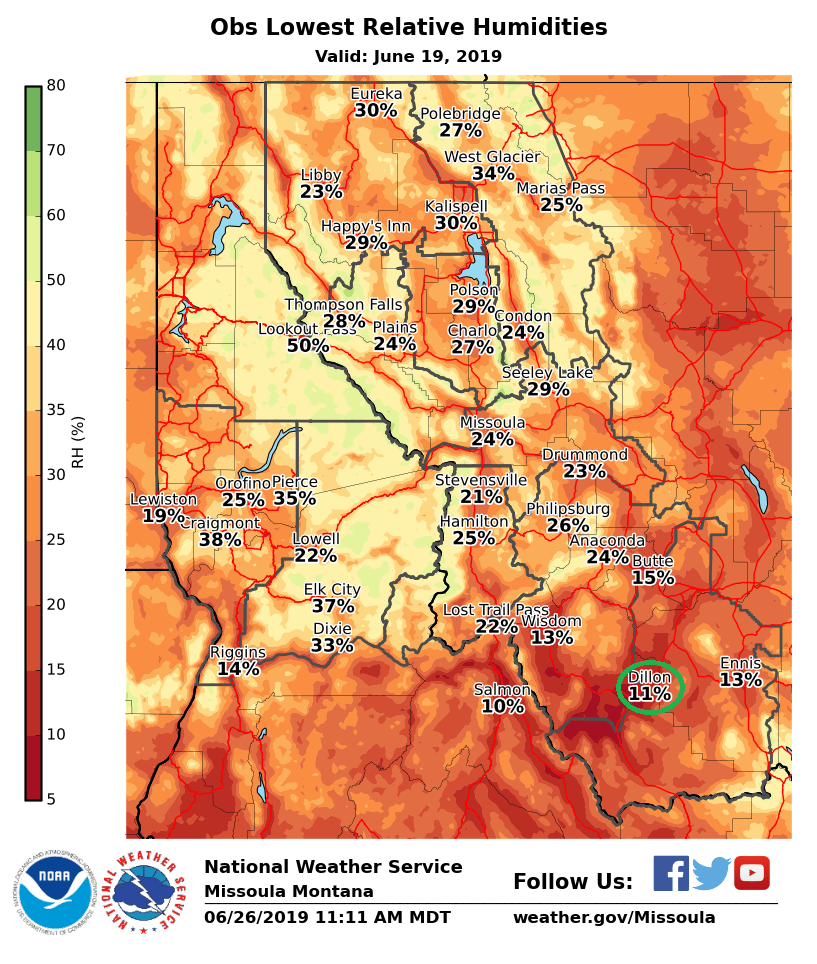
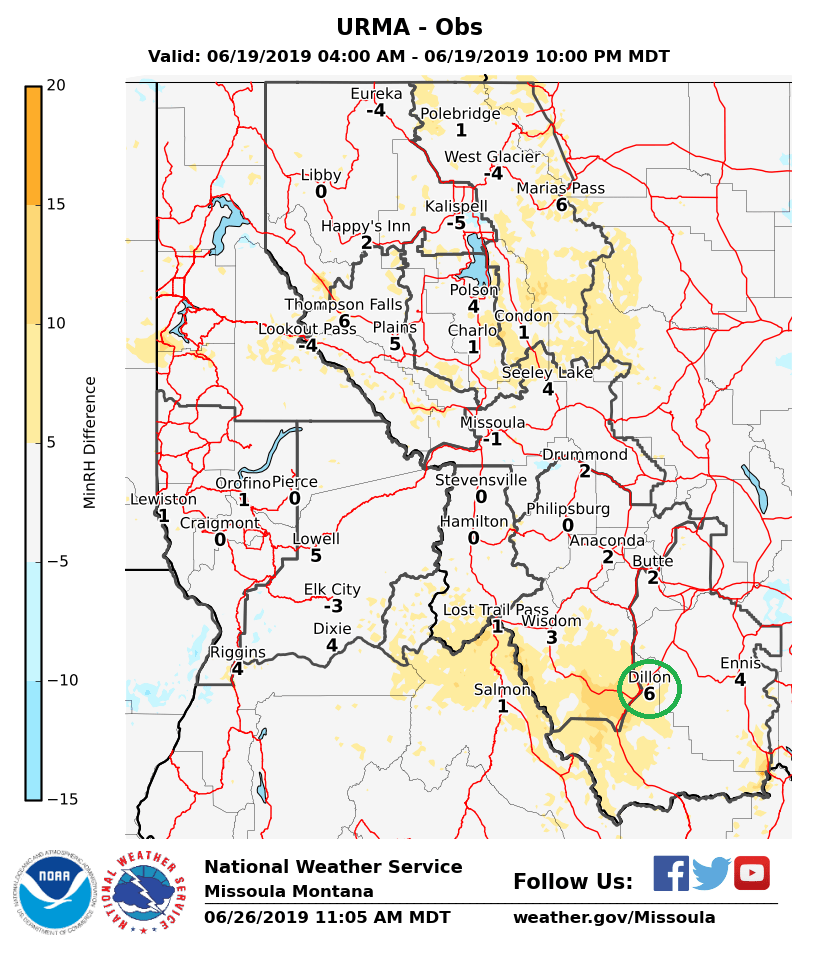
Another day to look at more recently is June 19th. I circled the ASOS location at Dillion, which reached 11% RH. Generally below 15% is considered critical for fire weather.

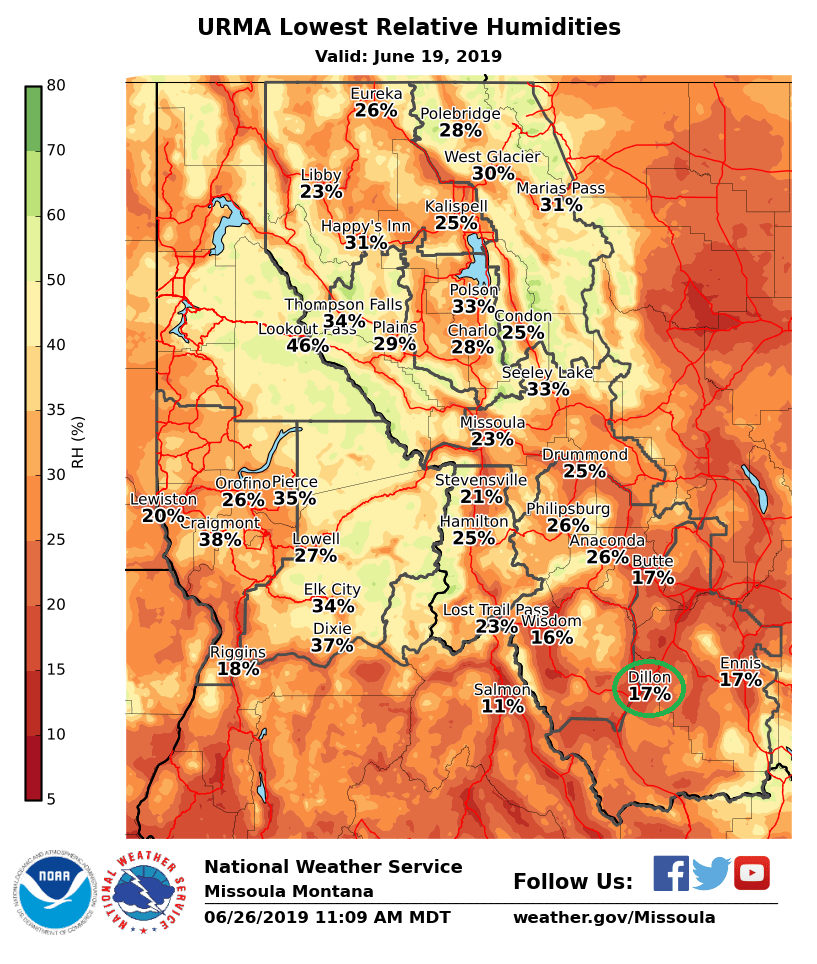
Looking at the URMA analysis below, across much of the area it is similar, but not in the driest area in SW Montana around Dillon. The high temperature at Dillon that day was 68F, so a 10F difference in dew point is required go from 11% to 17% RH.

Below is the difference grid again for comparison.


Below is a list of dates with the difference between the Obs and URMA for the Hells Half RAWS (HHAI1, 45.65, -114.63, 8100ft). This is a list of days where the difference was at least 7%.

<pre>
Dates with differences of 7.000000 or more
Date, abs(diff), Obs, URMA
2019040110, 7.999893, 51.998905, 59.998798
2019040210, 7.999124, 41.000940, 49.000064
2019040410, 14.999920, 58.999439, 73.999359
2019040710, 7.999776, 95.999081, 87.999306
2019041110, 20.000203, 87.999493, 67.999290
2019041210, 24.999615, 91.999370, 66.999754
2019041310, 11.000812, 87.999680, 76.998868
2019041410, 19.000080, 87.999493, 68.999413
2019041510, 13.999274, 84.998985, 70.999712
2019041610, 10.000203, 87.999989, 77.999786
2019041810, 7.000833, 34.000214, 41.001047
2019041910, 8.999626, 39.000566, 48.000192
2019042210, 10.999637, 34.000256, 44.999893
2019042410, 15.999685, 32.000182, 47.999866
2019042510, 11.000497, 21.000043, 32.000539
2019042710, 7.999252, 35.001335, 43.000587
2019042810, 7.999765, 83.999081, 75.999316
2019042910, 20.999535, 74.999076, 53.999541
2019043010, 7.000032, 64.999178, 57.999145
2019050110, 8.000417, 23.000123, 31.000539
2019050210, 7.999696, 36.000769, 44.000465
2019050510, 9.000454, 33.000855, 42.001308
2019050810, 10.999380, 46.000091, 56.999471
2019050910, 8.000593, 31.000283, 39.000876
2019051310, 9.999973, 20.000304, 30.000278
2019051810, 7.000865, 84.999957, 77.999092
2019052410, 8.000198, 49.000320, 57.000518
2019052510, 17.001250, 56.998659, 73.999909
2019052710, 7.001164, 64.998772, 71.999936
2019052910, 9.999776, 32.001047, 42.000822
2019053010, 12.997906, 40.001111, 52.999017
2019060310, 7.000091, 43.999535, 50.999626
2019061610, 9.999546, 35.000790, 45.000336
2019061810, 9.998227, 39.000855, 48.999081
2019062110, 7.999541, 91.999498, 83.999957
2019062410, 9.999573, 51.999573, 61.999145
2019062510, 7.999327, 55.999877, 63.999204
</pre>

Digging through the verification it seems the URMA wet bias is mostly at high elevations, with a much more mixed bag at lower elevations.  


My main concern is why aren't the Obs in the area being more closely matched? (More on that from Chris I think.)


This data is very important to us because of how it affects the NBM forecast. The humidity is used by our "deep core partners" in wildland fire. They are using it to run models that forecast fuel moisture (very dependent on RH) out to 7 days. These models are used to forecast/calculate fire danger (NFDRS) and the Severe Fire Weather Threat Index. These are used on a regional and national level as input for making decisions about where to allocate resources including fire fighting crews and aviation assets like helicopters and air tankers for fighting fire. So this data really matters and has an impact. Recently a weather forecaster at one of the regional centers told us that they use the NDFD MinRH when briefing, and that they've had to say, "but it will probably get lower than this today," when using it in briefings lately. 

RL
Ryan Leach, modified 5 Years ago.

RE: More on Humidity Bias analysis

Youngling Posts: 18 Join Date: 1/19/16 Recent Posts

If you're interested in the dew point differences between the Obs and URMA databases that would lead to these differences in RH, I calculated some "TdAft" grids for the same dates. Below are the differences in the "TdAft" grids.

MM
Matthew Morris, modified 5 Years ago.

RE: More on Humidity Bias analysis

Youngling Posts: 169 Join Date: 12/6/17 Recent Posts
We wanted to provide an update regarding upcoming changes to the RTMA/URMA dew point analyses.  The background is as follows:

The RTMA computes dew point through the following procedure.  The specific humidity and pressure analysis (background) is used to derive the analysis (background) dew point temperature.  The "analysis minus background" is computed then smoothed via a "1-2-1" filter and added to the downscaled dew point temperature to give the final dew point analysis.  The focus of the tests here is on the “1-2-1” filter, but we feel it is important to provide a full picture of how the dew point analysis is computed in the post processing portion of the RTMA.

The reason for recomputing the dew point analysis dates back to ~2005/2006 in the very early days of the RTMA.  At the time it was discovered that there was an inconsistency between the downscaled dew point (from the RUC at the time) and that derived separately based upon a computation of Td from the downscaled specific humidity, pressure, and temperature fields.  In this case it was noted that the downscaled Td fields had more fine structure detail in regions of complex terrain than the computed values.  The smoothing of the dew point increments was later implemented to mitigate instances of unreasonably low dew point values that would occur in the analysis.  Keep in mind this was well before the era of 3 km modeling systems, and thus required considerable downscaling of the background field.

To assess the impact of smoothing the Td increments in the current era of much higher resolution background fields (i.e. 3 km grid-spacing), retrospective experiments were run with the smoothing disabled to see how this may impact areas where the RTMA has been noted to be too moist, especially in the mountainous western U.S.  


Our results show that removing the smoothing results in a generally drier analysis in regions of complex terrain.  In flat areas the analysis is generally unchanged, which is expected.  An example of the local impacts of the change is depicted in the slide deck for 22z 29 June 2019.  Aggregate results (boxplots) show a tightening of the errors when the smoothing is disabled and is corroborated by a reduction in the standard deviation of the errors.  The same holds true for several winter retrospective experiments, including 20 January 2019.

Given the above findings, the smoothing of the dew point increments will be disabled in the upcoming v2.8 parallel (TBA) for possible implementation in the v2.8 package.  Recall that v2.8 is targeted for implementation in Q2FY2020.

Thanks to all for the continued input and helping us improve the RTMA.

Matt Morris
RTMA/URMA Developer

On Wed, Jun 26, 2019 at 3:12 PM VLab Notifications <VLab.Notifications@noaa.gov> wrote:

If you're interested in the dew point differences between the Obs and URMA databases that would lead to these differences in RH, I calculated some "TdAft" grids for the same dates. Below are the differences in the "TdAft" grids.


--
Ryan Leach RTMA/URMA Discussion Group Virtual Lab Forum https://vlab.noaa.gov/web/715073/home/-/message_boards/view_message/6949134VLab.Notifications@noaa.gov

Bookmarks

Bookmarks
  • 2011 RTMA Paper (Weather and Forecasting)

    The most recent peer-reviewed paper on the RTMA. Published in Weather and Forecasting in 2011.
    7 Visits
  • Public RTMA/URMA Viewer

    Another viewer of the current RTMA/URMA, with an archive going back 24 hours. This version is open to the public, but does not contain information about the (many) restricted obs used.
    54 Visits
  • RAP downscaling conference preprint (23rd IIPS)

    This link is to a presentation from the (then) RUC group on how the downscaling process works. Although we now use the RAP, HRRR, and NAM, the logic of the downscaling code is mostly unchanged from this point.
    2 Visits