Case Study Forum

Back

Displaying QPF/PQPF variants for geospatial comparisons

JS
Jack Settelmaier, modified 5 Years ago.

Displaying QPF/PQPF variants for geospatial comparisons

Youngling Posts: 29 Join Date: 11/2/12 Recent Posts
Here is an Operations Dashboard interface (housed in our NOAA Geoplatform ArcGIS Online environment) that is being dabbled with to (despite the inexact titling) that can help summarize ESRL's GEFS Reforecast Analog precip data
 
This interface displays not only WPC  95th pctile QPF for 72 hours (labeled as MRMS QPE12 presently!), but also the ESRL 0-7 day Deterministic QPF from analogs (labeled ESRL_QPF72).  BOTH only show areas forecast to receive 4" or more, by default.  
 
The ESRL layer, can be adjusted (down or up at 1" increments (in mm)) via the setting at the top of the interface (shown below), to reveal different QPF levels.  The ESRL data's lower limit is 2".
 
As soon as we overcome a data access issue, my plan is to create views of select NBM fields in such a way, as a means to view model trends, as a proxy for confidence.
 
image.png
 
Lastly, in prior years' feeding back thru Gary Bates and Tom Hamill at ESRL on these products, we (Victor M. and I--he's a heavy user of these graphics in his climate work) were able to get implemented the additional "purple haze" 8"+ color to their images, AND were able to get created images available from their website, such that ALL time-period images have _LATEST images for folks to always point to directly, say for social media use.  For example, this link (and shown below) is to the 0-7 day _latest image that, conveniently can be used to compare to the data in the auto-updating map interface.
 
image.png
--
Jack Settelmaier
(NRAP) Technical Lead, NOAA Big Data Project
Digital Techniques Meteorologist
NOAA/NWS, Southern Region HQ
Fort Worth, TX 
Work: 682 703 3685
JS
Jack Settelmaier, modified 5 Years ago.

RE: Displaying QPF/PQPF variants for geospatial comparisons

Youngling Posts: 29 Join Date: 11/2/12 Recent Posts

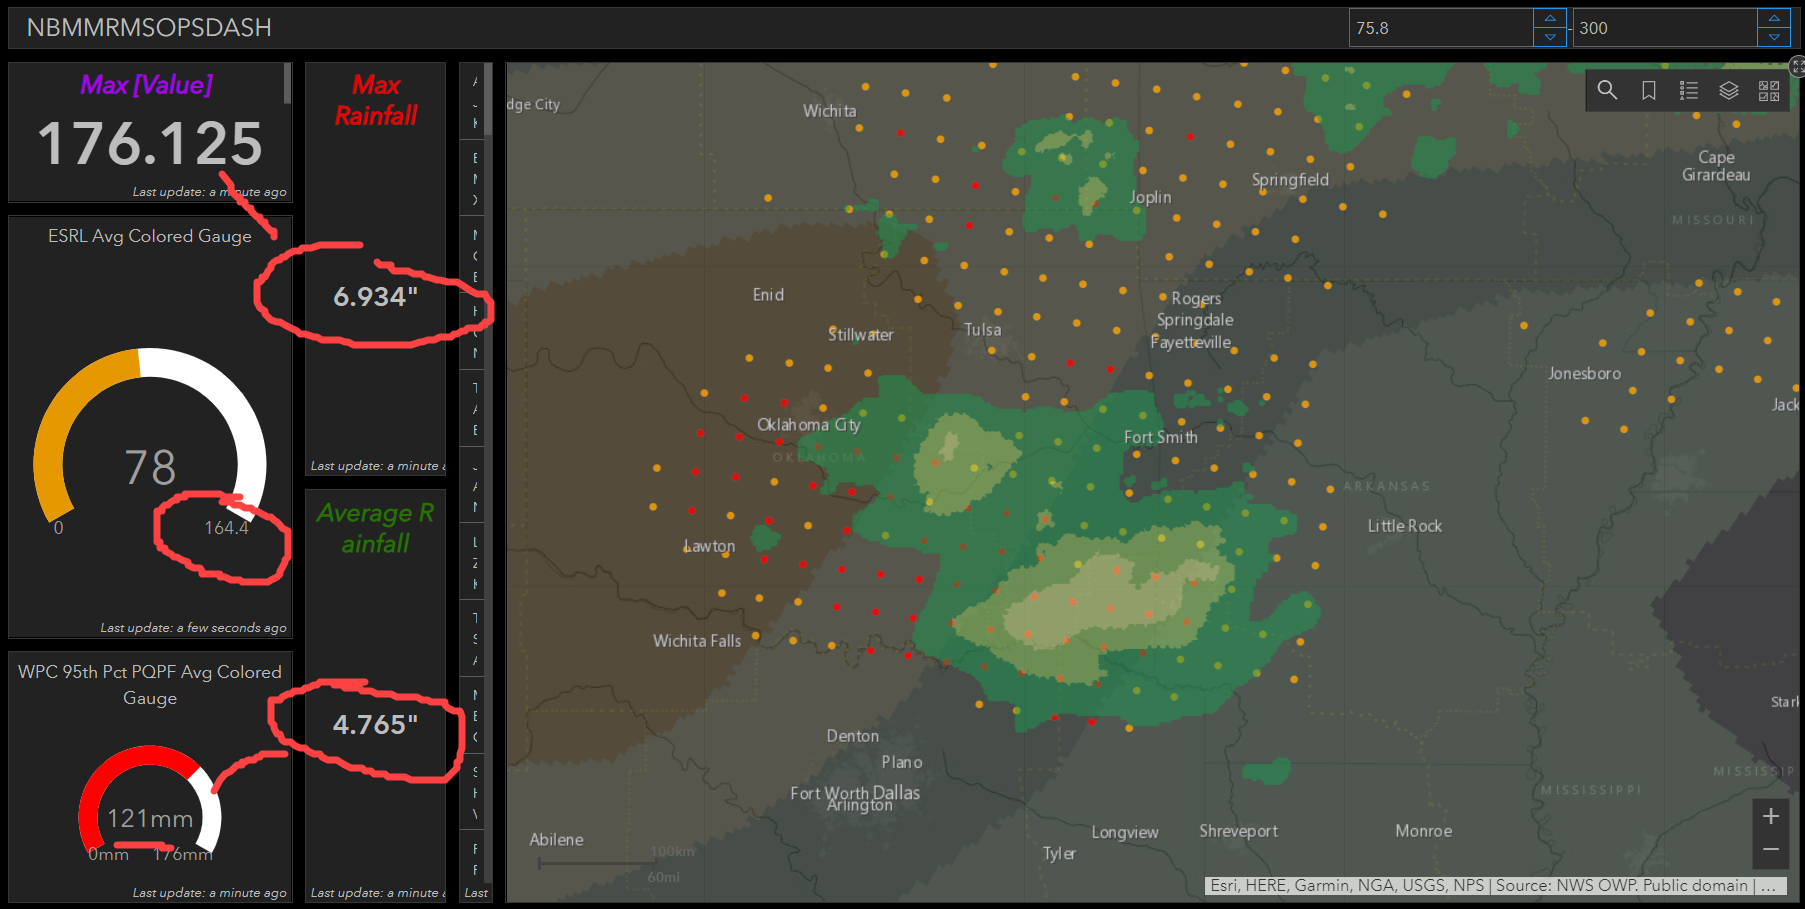
Today's (midday Sat, Jun 15th) Dashboard is indicating, over the recently-flooded Northeastern OK area,  average amounts of 5 inches, and up to 7 inches, respectively, over the next 72 hrs (WPC's 95th percentile 72-hr PQPF), and 7 days (ESRL's GEFS Deterministic Analog QPF).  To me, that indicates most of this rain is forecast to fall in the next 3 days, and not so much in Days 4-7.


Reply to Main Thread
Quick Reply