I wanted to share visual evidence as to the FV3's
superior? performance over the GFS in advertising the May 1 (actually
May 1-3 was a busy period) severe weather that occurred centered over
north central KS.
SPC Reports (May 1)
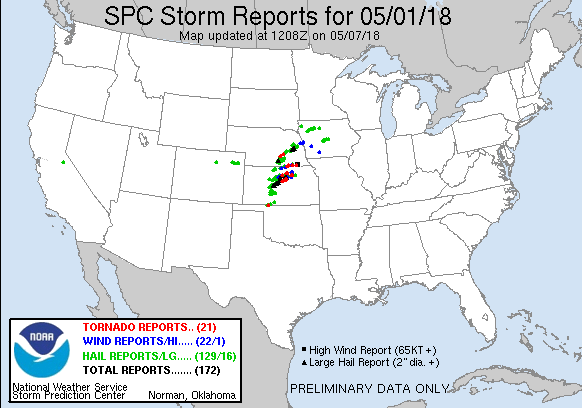
Forecast Hour=00 ("Observed")
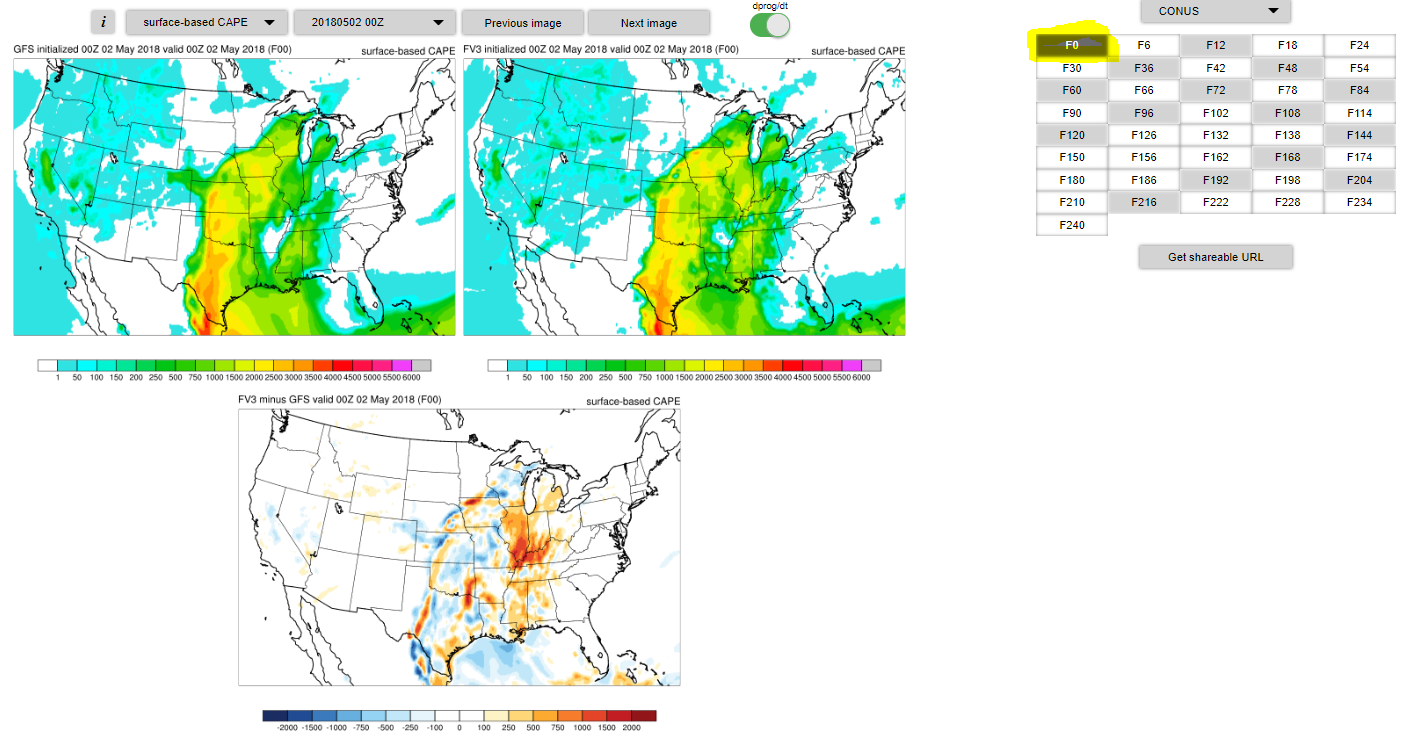
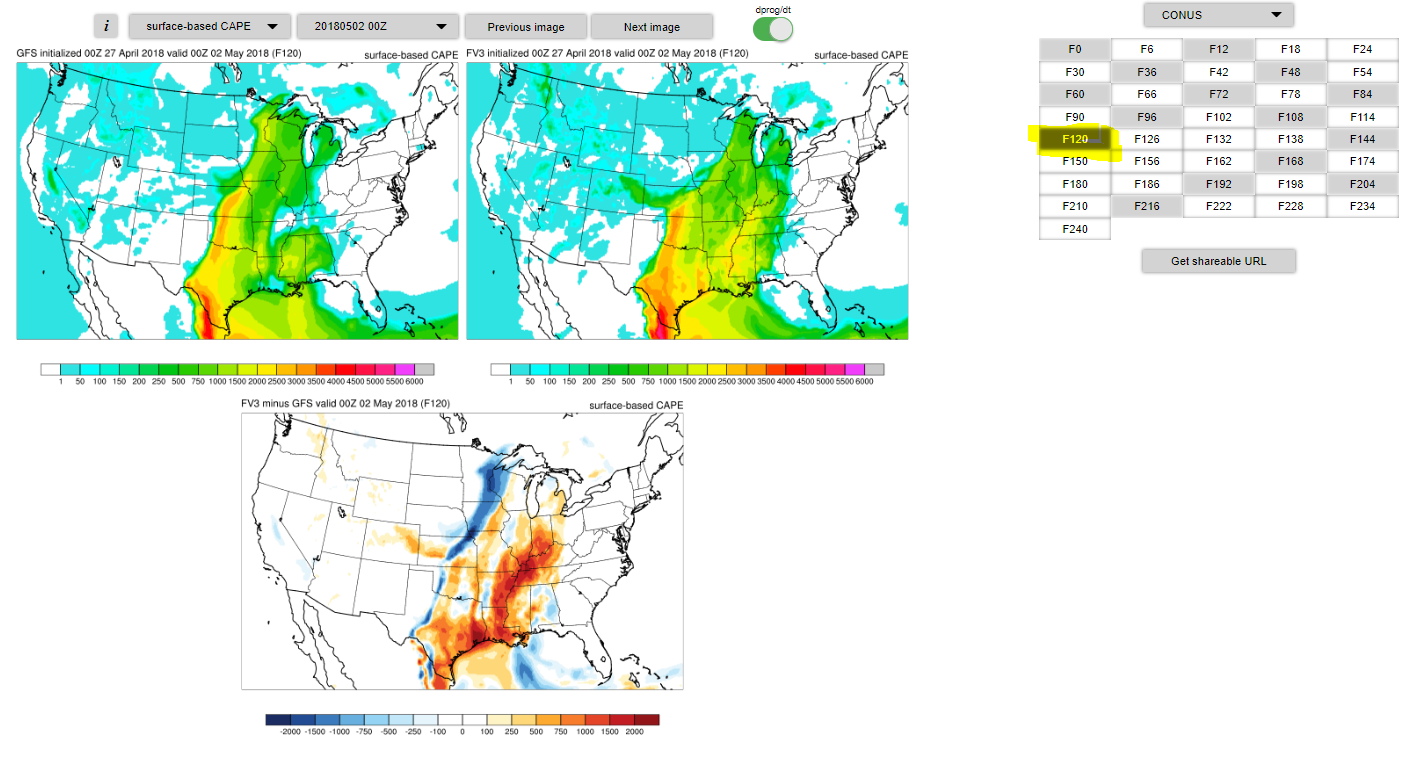
What I've provided here are FV3 and GFS surface-based CAPE forecasts
216-, 168-, and 120- hours in advance of May 1st--the day of the
event. I've also provided the 00-hr forecast as indication of
"roughly" the observed CAPE.
What can be seen is how the FV3, in its 216- and 168-hr forecasts,
was a) showing much larger CAPE to the south and east (inflow area) of
where the multiple tornado reports occurred. b) These forecast values
were larger than those "observed." c) Arguably, however,
the greater forecast values in the FV3 vs the GFS provided more
indication of the upcoming impact event, despite having CAPE values
too large.
Forecast Hour=216
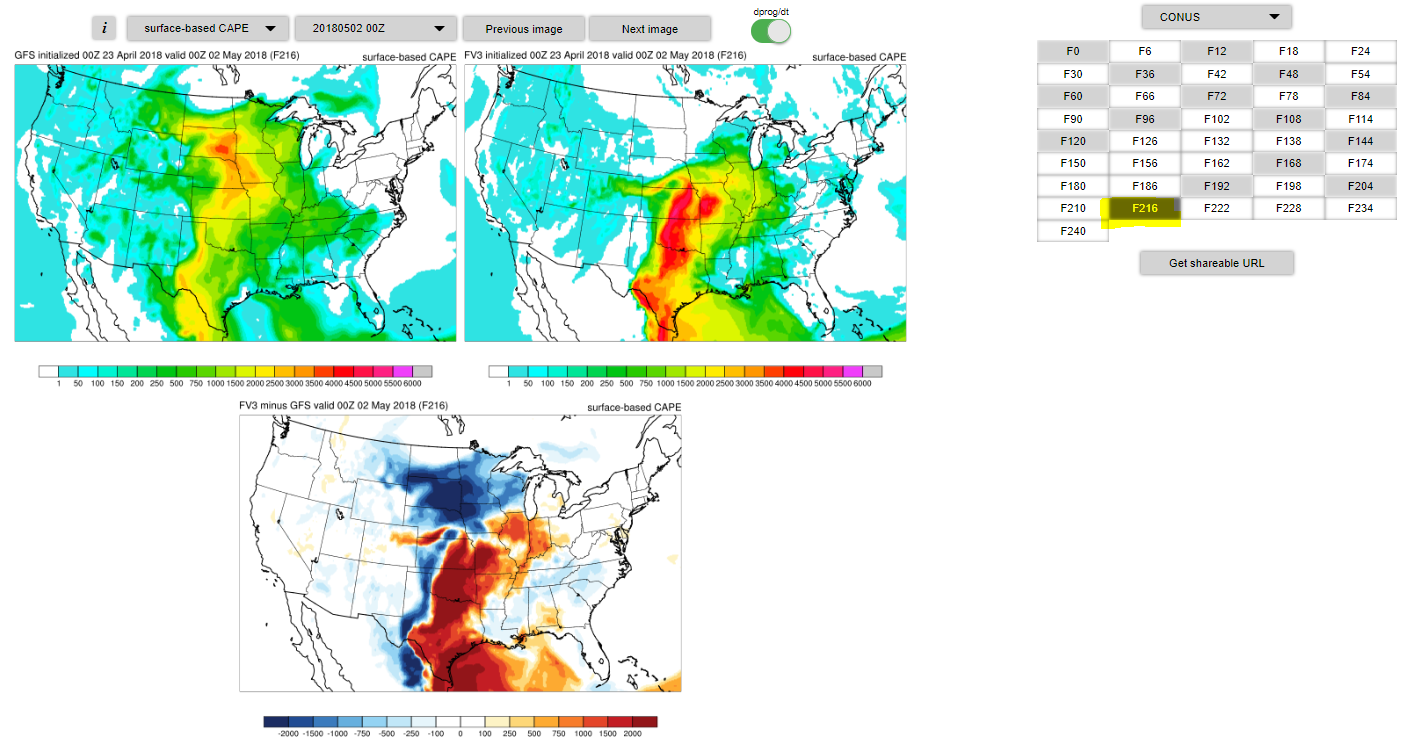
Forecast Hour=168
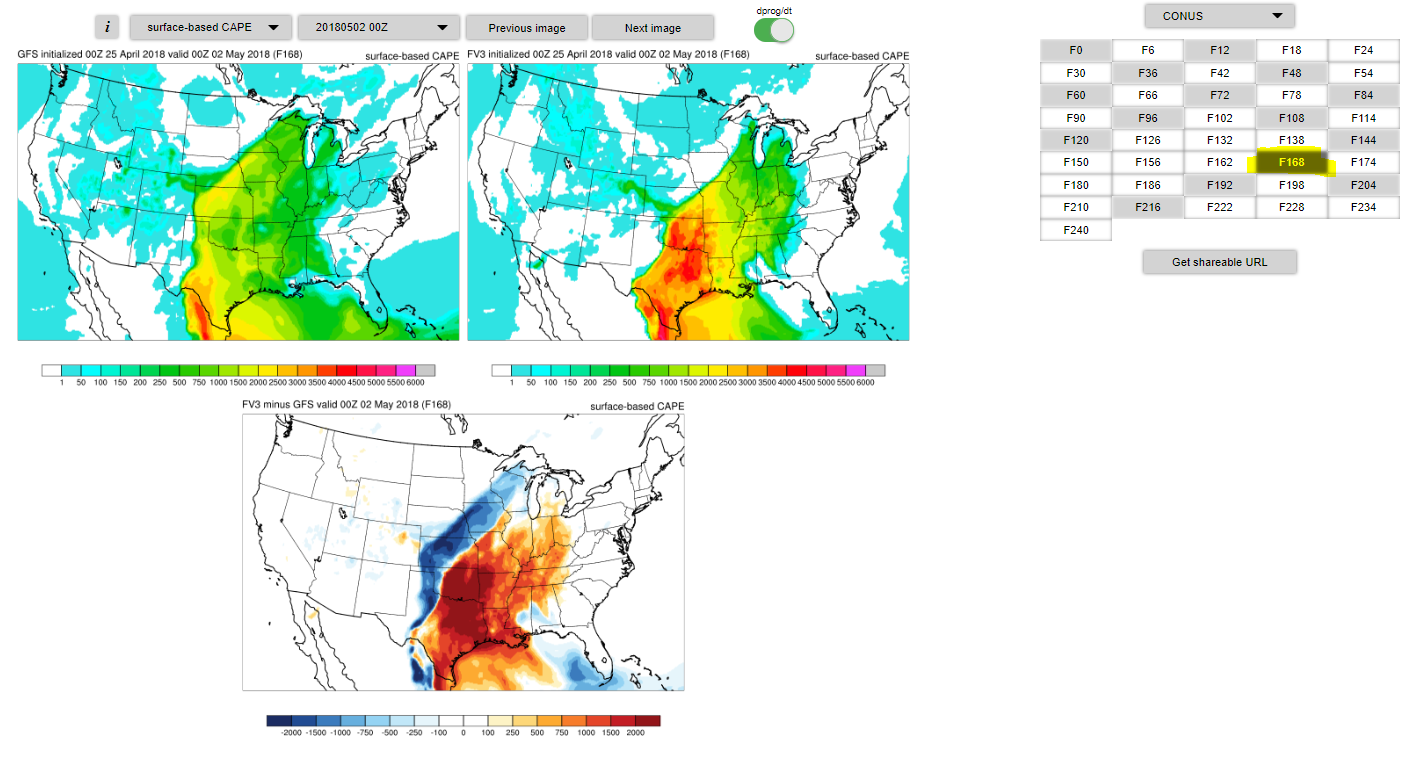
I only show the 120-hr as at that forecast hour and closer in toward
the observed time (lower forecast hours), d) both models had basically
the same values shown.
Forecast Hour=120
So, did the FV3 "win" this event? Its higher CAPE values
certainly would draw more attention to an upcoming event, which in
this case DID occur, BUT, might the FV3 be overvigorous in its "energetics?"
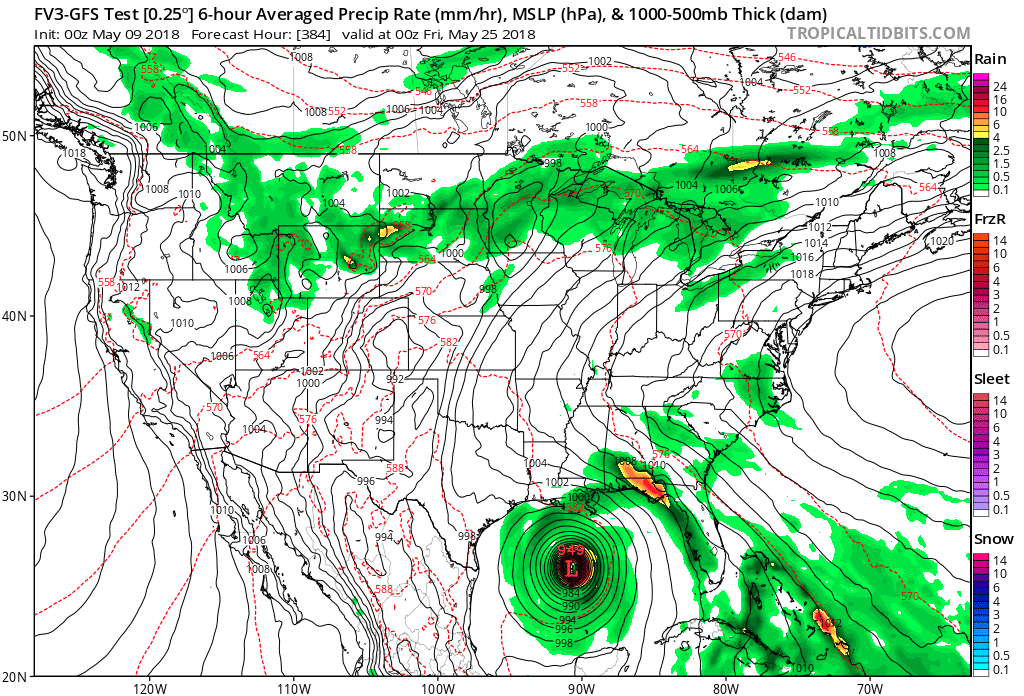
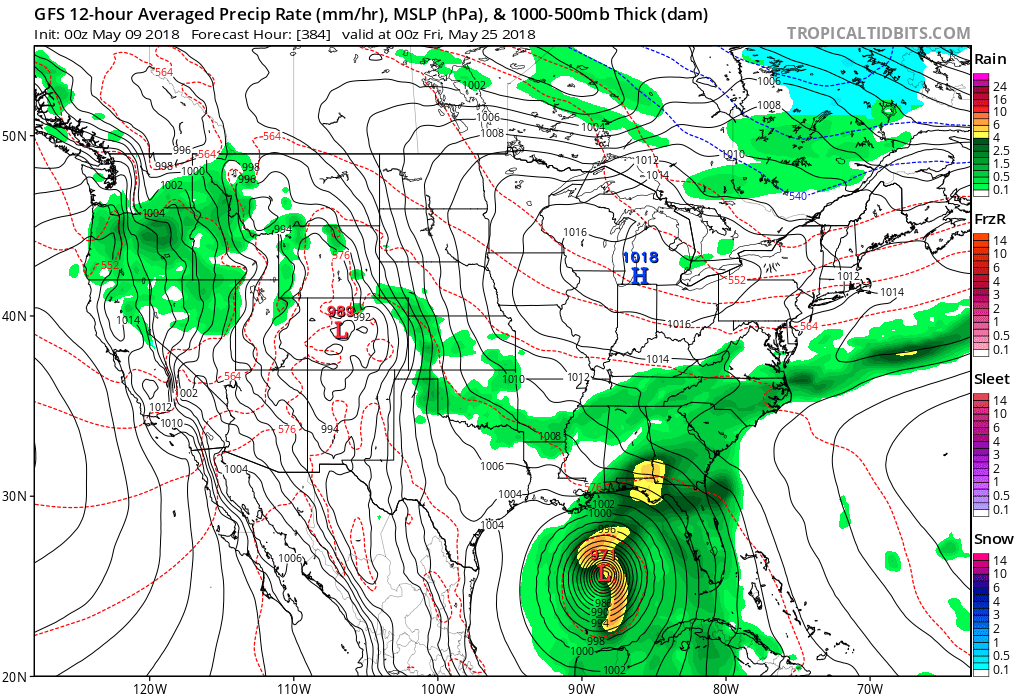
Lastly, with regard to possibly being over-energetic, I have included
both 384-hr MSLP forecasts from the 00Z May 9th runs of the GFS and
FV3, as displayed on the TropicalTidbits website, valid for the Friday
heading into the Memorial Day 2018 weekend. Both show a vigorous
tropical system in the Gulf. FWIW, other nearby model runs have a
similar feature, but at different time projections.
FV3 384-hr Forecast
GFS 384-hr Forecast
Some WFO/SPC reference information at these links:
EF-3, couple of EF-1s on May 1st.
https://www.weather.gov/top/180501_Summary
http://www.spc.noaa.gov/climo/reports/180501_rpts.html
EF-1s on May 2nd.
https://www.weather.gov/eax/may022018
TORs each day.


